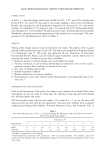
SKIN MOISTURIZATION: LONG-TERM RESULTS 25 enrolled in the one-hour test. All subjects had dry skin on their lower legs, i.e., a grade of at least 1 on a 0-4 scale (Table I). Exclusion criteria are reported in the previous paper. The study was approved by the Institutional Review Board of the University of Cin- cinnati, and all subjects signed an informed consent form. TREATMENT PROTOCOL The treatment sites were on the outer aspect of the calf. Subjects were instructed to refrain from any use of lotion on the lower leg for seven days before entering the study. Shaving the legs was only allowed twice a week, at least 48 hours prior to evaluations. Two sites of 9 x 10 cm on each calf were marked with a surgical marking pen (Surgical Skin Marker, Precision Dynamics Corp., San Fernando, CA). Each site was treated with the assigned lotion for a period of two weeks (14 days). Lotion placement was random- ized using a balanced design. An amount of 0.25 ml was applied to the test sites, thereby providing approximately 2.7 mg/cm 2 of product. The lotions were rubbed in to cover the site evenly. The first treatment was applied by the investigator, and the subjects were trained to apply the remaining treatments at home. The subjects in the two-week study applied the lotions twice a day, once in the morning and once at night. For measurement days, subjects refrained from applying the treatment in the morning. They did apply a treatment the evening prior to the measurements. They resumed lotion application after the measure- ments were taken. For the one-hour study, the 0.25-ml quantities of lotion were applied evenly only one time. MEASUREMENTS: ONE-HOUR TEST Instrumental measurements were made before product application (baseline) and again one hour after lotion treatment. Measurements of electrical properties and TEWL were made with the Nova © DPM 9003, the Skicon © 200, the Corneometer © CM 825, and the DermaLab © evaporimeter. MEASUREMENTS: TWO-WEEK TEST Measurements were made before product application (baseline), after one week (7 days), Table I Grading Scale for Dry Skin Condition Grade Description 0 1.0 2.0 3.0 4.0 No scaling Patches of slight powderiness and occasional patches of small scales distribution generalized Small scales in combination with a few larger scales, slight roughness, whitish appearance Small and large scales uniformly distributed, definite roughness, possibly slight redness and possibly a few superficial cracks Dominated by large scales, advanced roughness, redness present, eczematous changes and cracks

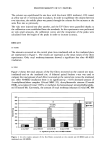
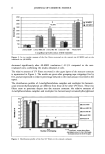
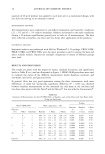
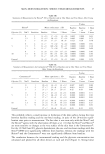
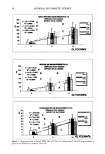
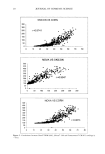
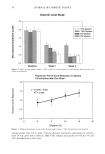
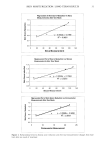
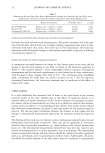
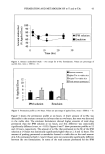
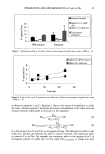
26 JOURNAL OF COSMETIC SCIENCE and after two weeks (14 days) of treatment. Note that the measurements were made 12-18 hours after the treatments had been applied on the previous evening. Instrumen- tal measurements were taken with the Nova © DPM 9003, the Skicon © 200, the Cor- neometer © CM 825, and the DermaLab © evaporimeter. Grading was performed in a double-blind fashion by a trained grader at baseline, one week and two weeks after treatment at the same time as the instrumental measurements. The grading scale for dryness/scaling is shown in Table I (14). ENVIRONMENTAL CONDITIONS All measurements were conducted under controlled temperature and humidity condi- tions (22 + 2øC and 45 + 5% relative humility) according to the guidelines for stan- dardized hydration measurement (1). The subjects acclimated to the room conditions for at least 30 minutes before any measurements were made. STATISTICAL ANALYSIS All statistical work was completed with SAS for Windows © 6.12 package. PROC REG, PROC CORR, and PROC GLM with options of Student t-test and Scheffe and Duncan multiple comparisons were used in analysis of the data. RESULTS AND DISCUSSION ELECTRICAL MEASUREMENTS Electrical measurements at one hour, one week, and two weeks are reported in Table II. Significant increases (p 0.0001) in readings relative to baseline were observed after one hour, one week, and two weeks of glycerin treatment with all three devices. All of the differences were significant relative to baseline. The one-hour measurements demonstrated the largest increase in readings, and the two-week measurements showed the lowest. It should be pointed out that the readings at one and two weeks were taken at least 16 hours after the last application of moisturizer. Therefore, they reflect the long-term effects on the skin rather than the short-term effects of the lotion. There was a linear increase in readings with glycerin concentration after one hour of treatment with all three devices, corroborating the findings reported in Part I. The relationships at one week were also linear for each device, as shown in the regression plots (Figure 1). TRANSEPIDERMAL WATER LOSS TEWL was significantly lower than baseline one hour after application for all glycerin levels, including the 0% glycerin control (Table III). A weak linear relationship was observed between the extent of the TEWL reduction and the glycerin concentration (R-squared value = 0.8054). These results are consistent with those of Bart et al., who reported significant reduction in TEWL one hour after application of 5% and 15% aqueous glycerol solutions (16).
Purchased for the exclusive use of nofirst nolast (unknown)
From: SCC Media Library & Resource Center (library.scconline.org)