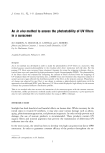
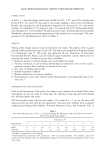
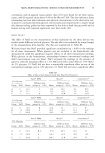
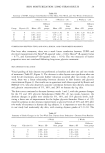
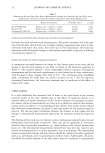
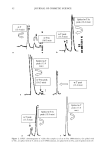
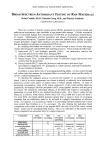
SKIN MOISTURIZATION: LONG-TERM RESULTS 27 Table II Summary of Electrical Measurements by Nova © DPM 9003, Skicon © 200, and Come©meter © CM 825 at One Hour, One Week, and Two Weeks after Glycerin Treatment Nova measurement (AU): Difference from baseline 1 Hour 1 Week 2 Weeks Different Different Different from from from Group Glycerin (%) Mean _+ SD groups Mean _+ SD groups Mean _+ SD groups A 0 37-+28 B,C,D 20_+ 19 C,D 12_+ 12 D B 5 148 _+ 72 A, C, D 51 ñ 49 D 25 ñ 19 -- C 10 237 _+ 99 A, B 97 -+ 115 A 33 -+ 49 -- D 15 267 _+ 110 A, B 118 _+ 115 A, B 51 _+ 72 A Skicon measurement (pS): Difference from baseline 1 Hour 1 Week 2 Weeks Different Different Different from from from Group Glycerin (%) Mean _+ SD groups Mean _+ SD groups Mean _+ SD groups A 0 12_+14 B,C,D 22_+22 C,D 18ñ 13 B,C,D B 5 85 -+ 62 A, C, D 61 _+ 48 D 42 -+ 24 A C 10 183 -+ 110 A, B, D 107 _+ 116 A 49 _+ 39 A D 15 250 _+ 130 A, B, C 130 _+ 143 A, B 54 _+ 45 A Corneometer measurement (AU): Difference from baseline 1 Hour 1 Week 2 Weeks Different Different Different from from from Group Glycerin (%) Mean _+ SD groups Mean _+ SD groups Mean _+ SD groups A 0 3_+4 B,C,D 8_+9 C,D 7_+9 D B 5 16_+9 A,C,D 15ñll D 14_+10 -- C 10 25 -+ 12 A, B 19 _+ 12 A 14 _+ 11 -- D 15 27 -+ 12 A, B 23 -+ 13 A, B 17 _+ 13 A One week after twice-daily treatment with the formulations, TEWL was significantly lower than the baseline values prior to the first application of 5%, 10%, and 15% glycerin. The 0% glycerin control was not different from baseline. However, the barrier response to glycerin, as indicated by TEWL, was not linear with concentration. After two weeks of treatment, the TEWL for the 0% glycerin control was significantly higher than at baseline prior to formula applications. Relative to the 0% glycerin control, the change from baseline TEWL value for the 5% glycerin formula was sig- nificantly lower than that for the 0% control, while the changes for the 10% and 15% levels were not different. The TEWL measurements after two weeks of treatment did not follow the pattern in the one-hour and one-week measurements. The TEWL values for the glycerin-containing formulations were not significantly different from baseline. The largest overall change was 2.0 g/m2/hr, a relatively small change for the TEWL param- eter. All TEWL values indicated normal barrier function.

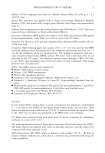
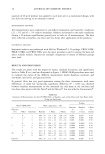
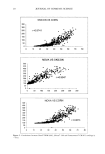
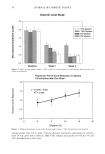
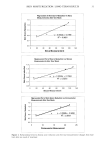
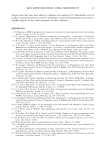
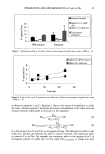
28 JOURNAL OF COSMETIC SCIENCE 250 200 150 100 50 Regression Plot of Nova Measurement (change from baseline) vs Glycerin Concentration after One Week y = 6.8x + 20.5 R 2 = 0.9822 0 5 10 15 Glycerin (%) 20 25O 2OO 150 100 5O 0 Regression Plot of Skicon Measurement (change from baseline) vs Glycerin Concentration after One Week y= 8x= 17.5 R = 0.976• , i , , 0 5 10 15 20 Glycerin (%) 4O 35 3O 25 2O 15 10 5 0 -5 Regression Plot of Corneometer Measurement (changes from baseline) vs Glycerin Concentration after One Week y = 0.98 + 8.9 R 2 = 0.978 0 5 10 15 2O Glycerin (%) Figure 1. Linear plots of one week Nova © DPM 9003, Skicon © 200 and Corneometer © CM 825 measure- ments (mean + SE) vs glycerin concentration.
Purchased for the exclusive use of nofirst nolast (unknown)
From: SCC Media Library & Resource Center (library.scconline.org)