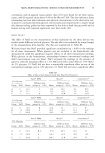
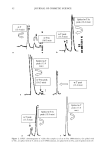
40 JOURNAL OF COSMETIC SCIENCE to confirm the absence of any degradation during these analytical manipulations and to ensure complete extraction of a-TAc and a-T. RECEPTOR TREATMENT Receptor solutions were collected in glass scintillation vials every eight hours, and the BSA was precipitated using 4 ml of ACN. The drug was extracted into the organic n-hexane layer (5 ml) by shaking the above mixture for 45 minutes on a wrist-action shaker followed by a 45-minute centrifugation process. This procedure was repeated two times. Centrifugation was followed by careful removal of the n-hexane layer into 30-ml glass tubes and evaporation of the organic phase. This procedure had been validated previously to ensure complete extraction of the •-TAc and •-T from the receptor. Acetonitrile (1.5 ml) was added and vortexed to ensure good mixing. Sufficient quantity of this mixture was filtered and injected into the HPLC. Thus, the amount of ot-TAc and its metabolite was estimated in the following four locations in each in vitro permeation experiment: (a) receptor fluid, (b) washes, (c) stratum corneum (from strippings), and (d) viable tissues of the skin. •-TAC AND •-T ANALYSIS For the quantitative determination of •-TAc and •-T alone and in the presence of each other, HPLC analysis was used. By means of a Waters 717 autosampler, samples were taken from glass vials and injected into an HPLC apparatus. The latter consisted of a Waters 600 controller connected to a column (3.9 x 300 ram, p Bondapack RP (Waters Corporation) and a variable wavelength detector (Waters 486 tunable absor- bance detector) set at 285 nm. Chromatographic data were processed by a Waters 746 data module integrator. With acetonitrile (ACN)-water (96:4) as the mobile phase (flow rate 1.4 ml/min), the retention times were 16 minutes for •-TAc and 13 minutes for •-T. The detection limits were 0.5 pg/ml (ot-TAc) and 0.25 pg/ml (a-T). The HPLC method was validated prior to use, using USP standards. Limit of quantitation, interday variability, and system suitability were performed on the system previously described. The peak areas were converted into concentrations (pg/ml) using a standard curve developed under conditions of Beer-Lambert's law. This was further converted into micrograms of compound using the dilution factor for each sample. The final results were expressed as percentage of applied dose. STATISTICAL ANALYSES Microsoft Excel (1997) was used to compile and statistically analyze the data. Student's t-test was performed to find significant differences at the o• = 0.05 level. Values are given as means _+ SEM. RESULTS In order to delineate the kinetics of permeation and metabolism of ot-TAc across pig skin, a series of in vitro permeation experiments terminating at the end of 2, 6, 12, and

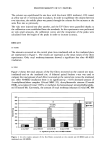
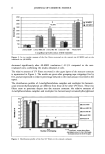
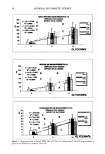
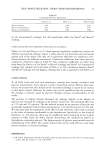
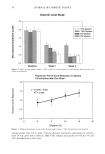
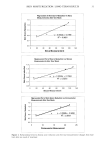
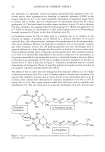
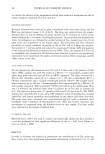
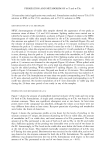
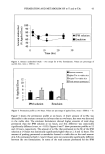
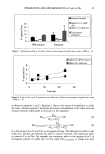
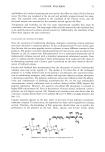
PERMEATION AND METABOLISM OF o•-T and o•-TAc 41 24 hours after initial application was conducted. Formulations studied were o•-TAc (5 %) solution in IPM, o•-TAc (5%) emulsion, and o•-T (1%) solution in IPM. IDENTIFICATION OF o•-TAc METABOLITE HPLC chromatograms of viable skin samples showed the appearance of two peaks at retention times of about 13.4 and 16.0 minutes. Spiking studies were carried out to identify the nature of the metabolite, as shown in Figure 2. Figure 2a depicts the HPLC chromatogram of viable skin sample obtained in the o•-TAc permeation study. When this mixture was spiked (1:1) with known amounts of o•-TAc standard (Figure 2b), and the volume of injection remained the same, the peak at 16 minutes increased in area whereas the peak at 13 minutes was halved in area due to the 1:1 dilution of the mix. Correspondingly, when the original mixture was spiked (1:1) with standard o•-T (Figure 2c), the peak at 13 minutes increased in area whereas the peak at 16 minutes was halved in area, showing that the peak at 13 minutes was indeed the metabolite, {x-T, and the peak at 16 minutes was the prodrug peak (o•-TAc). Spiking studies were also carried out with the viable skin sample obtained from the o•-T permeation experiment. Only one peak at 13 minutes was obtained in the original (Figure 2d) eluent. When spiked with known amounts of o•-TAc (Figure 2e), a new peak was obtained at 16 minutes, account- ing for the added prodrug. With standard o•-T spiking (Figure 2f), a existing parent peak in Figure 2d increased in area. No peak was found at 16 minutes. This confirmed unequivocally that the metabolite obtained from o•-TAc bioconversion was indeed o•-T. In the case of o•-TAc formulations no more than two peaks (corresponding to o•-TAc and {x-T) were observed, and for the o•-T formulation only one peak (corresponding to o•-T itself) was observed. No further metabolites of o•-T were detectable in viable pig skin during the 24-hour time period of our study in any of the samples. PERMEATION AND METABOLISM OF o•-TAc Figure 3 shows the amount of unabsorbed material inclusive of the wash and two strips for both o•-TAc formulations. A single peak corresponding to o•-TAc was found in the stratum corneum. There was significant absorption even at two hours. At later time points more of the compound was absorbed, although the values at six hours were not very different from those at later times. Receptor quantities of prodrug and metabolite were below the limits of detection. Figure 4 shows the permeation profile at two hours for the levels of prodrug in the stratum corneum (15 strips), the amount of prodrug (o•-TAc) in viable skin, the amount of metabolite ({x-T) in viable skin, and total amount of o•-TAc permeated. The total amount of o•-TAc permeated is the sum of both o•-T and o•-TAc in the SC and viable skin. Sufficient quantity of the prodrug was detectable even at the end of two hours in the SC. Interestingly, o•-TAc levels in the viable skin were below the limits of detection at the end of two hours. This implied essentially complete metabolism of o•-TAc into o•-T during this time period. Bioconversion was restricted to the viable skin, and no o•-T was detected in the stratum corneum for both the o•-TAc formulations. No significant difference was obtained between the two o•-TAc formulations with respect to the total amount of o•-TAc permeated at the end of two hours (t-test, o• = 0.05).
Purchased for the exclusive use of nofirst nolast (unknown)
From: SCC Media Library & Resource Center (library.scconline.org)