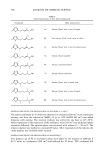
444 JOURNAL OF COSMETIC SCIENCE with 0.2 ml of each solution applied to each patch. One set had 21 consecutive appli- cations of the test articles for 23 + 1 hours. Scoring for cumulative irritation and reapplication was done every 24 hours or until excessive irritation terminated further exposure. The second set had applications removed every other day on Monday, Wednes- day, and Friday for fourteen days. Scoring for cumulative irritation was done 48 hours after patch application (72 hours over the weekend). The six test articles used in this study were: A: Physiological saline 0.89% B: Mineral oil 100% U.S.P. C: Urea 20% aqueous D: Lactic acid 2.5% aqueous E: Sodium lauryl sulfate 0.1% aqueous F: Isopropyl myristate 50% in mineral oil Irritation was scored classically using a 100-watt incandescent blue bulb lamp as the artificial light source to illuminate the patch areas. The scorer was blinded as to treat- ment assignments. The following scale was used: 0: No evidence of irritation 1: Minimal erythema, barely perceptible 2: Definite erythema, readily visible or minimal erythema or minimal papular response 3: Erythema and papules 4: Definite edema 5: Erythema, edema, and papules 6: Vesicular eruption 7: Strong reaction spreading beyond test site Superficial textural changes were scored as follows: A: Slightly glazed appearance B: Marked glazing C: Glazing with peeling and cracking F: Glazing with fissures G: Film of dried serous exudate covering all or portion of patch site H: Small petechial erosions and/or crust s: Scaling y: Hyperpigmentation STATISTICAL ANALYSIS The actual patch test scores are a combination of a numerical and letter score consistent with the definitions given in the scoring scale. In order to perform statistical analyses, scores containing letter grades were converted to numerical equivalents. These were converted as follows: A -- 0, B = 1, C = 2, and F, G and H = 3. These equivalents are considered additive to any numerical score (e.g., 2C = 2 + 2 -- 4). However, an upper limit of 3 is selected since the intent of this test was to compare treatments that are relatively mild. Thus, for any value greater than 3, a value of 3 is used in the statistical analysis. Furthermore, following the development of a strong reaction, no further ex-

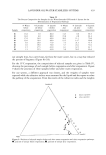
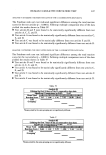
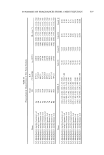
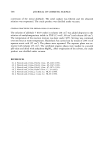
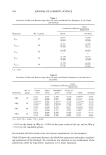
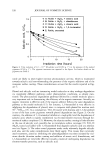
HUMAN CUMULATIVE IRRITATION TEST 445 posure was made and a score of 3 was carried forward for all scoring days for the remainder of the test. The following statistical analyses were performed: 1. Analysis 1 was performed on the data from the 21 consecutive days. 2. Analysis 2 was performed on the first 14 consecutive days from the 21-day data. 3. Analysis 3 was performed on the data from the 14-day every-other-day patching scheme. 4. Analysis 4 was performed on the first ten consecutive days from the 21-day data. 5. Analysis 5 was performed on the first seven consecutive days from the 21-day data. 6. Analysis 6 was performed on the first four consecutive days from the 21-day data. The transformed patch test scores for each test article were summed across all test days for each test subject. The overall test article scores were ranked within each subject and then analyzed using the Friedman rank sum test (4). The hypotheses for this test are shown below: Ho: The rank sums of the test articles were identical. Ha: At least two of the rank sums differed. Multiple comparison testing was performed using Fisher's LSD test (4) if significant differences (p -- 0.05) were observed with the Friedman rank sum test. NOTE: For the 21-day test the maximum summed score for a subject for any test article is 63, which would indicate the development of a strong reaction on test day 1 (score of 3 for 21 days = 63). The most irritating test article in this study, test article D (2.5% lactic acid), had a mean total score of 51.95, indicating that most subjects achieved the maximum score of 3 by test day 3 or test day 4. RESULTS Forty-one subjects, 18-50 years of age, completed the test. ANALYSIS 1 (21 CONSECUTIVE PATCH APPLICATIONS) The Friedman rank sum test indicated significant differences among the total reaction scores for the test articles (p = 0.0001). Followup multiple comparison tests of the data yielded the following result: © The six test articles were found to be statistically significantly different from each other (Table I). ANALYSIS 2 (UTILIZING THE FIRST 14 DAYS OF THE 21-CONSECUTIVE-DAYS DATA) The Friedman rank sum test indicated significant differences among the total reaction scores for the test articles (p = 0.0001). Followup multiple comparison tests of the data yielded the following result: ß The six test articles were found to be statistically significantly different from each other (Table II).
Purchased for the exclusive use of nofirst nolast (unknown)
From: SCC Media Library & Resource Center (library.scconline.org)