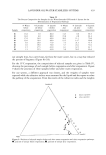
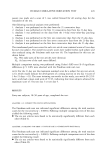
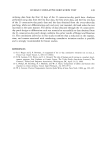
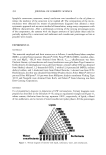
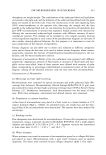
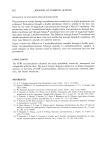
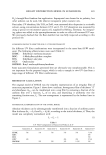
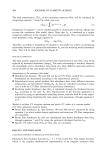
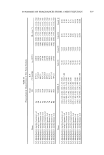
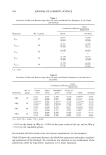
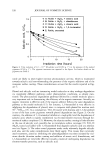
446 JOURNAL OF COSMETIC SCIENCE Table I Analysis #1 21 consecutive -atch a-•lications Si nificant Com arisons (0.05) N=41 Mean Total B /r A C ' ' E Reaction Score 3.41 4.46 8.46 20.24 47.78 LSD Grouping • D 51.95 •Means joined by the same grouping are not significantly different. Table II Analysis #2 Utilizing the first 14 days of the 21 consecutive days data Significant Comnarisons (n0.05 N=41 Mean Total "'/r F , A C ' •. ' F ..:..i..•D Reaction Score 1.80 2.73 5.20 10.88 28.02 31.90 LSD Grouping • •Means joined by the same grouping are not significantly different. Table III Analysis #3 14-day data -- patch applications every,,9ther day Significant Comparisons (n0.05) N=41 Mean Total :•'B .... •.F •]-•i•.. : .•E' "•• ReactionScore [1.12. I ,1.90 I 2.63 I 3.04 I 10.10 I 11.88 LSD Grouping • •Means joined by the same grouping are not significantly different. ANALYSIS 3 (14-DAY DATA--PATCH APPLICATIONS EVERY OTHER DAY) The Friedman rank sum test indicated significant differences among the total reaction scores for the test articles • = 0.0001). Followup multiple comparison tests of the data yielded the results shown in Table III: © Test articles B and F were found to be statistically significantly different from test articles A, C, E, and D. © Test articles A and C were found to be statistically significantly different from test articles E and D. © Test article E was found to be statistically significantly different from test article D.

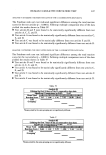
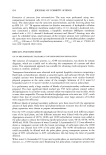
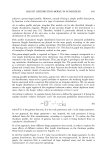
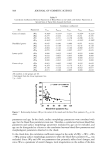
HUMAN CUMULATIVE IRRITATION TEST 447 ANALYSIS 4 (UTILIZING THE FIRST TEN DAYS OF THE 21-CONSECUTIVE-DAYS DATA) The Friedman rank sum test indicated significant differences among the total reaction scores for the test articles (p = 0.0001). Followup multiple comparison tests of the data yielded the results shown in Table IV: © Test articles B and F were found to be statistically significantly different from test articles A, C, E, and D. © Test article A was found to be statistically significantly different from test articles C, E, and D. © Test article C was found to be statistically different from test articles E and D. © Test article E was found to be statistically significantly different from test article D. ANALYSIS 5 (UTILIZING THE FIRST SEVEN DAYS OF THE 21-CONSECUTIVE-DAYS DATA) The Friedman rank sum test indicated significant differences among the total reaction scores for the test articles (p = 0.0001). Followup multiple comparison tests of the data yielded the results shown in Table V: ß Test articles B and F were found to be statistically significantly different from test articles A, C, E, and D. ß Test article A was found to be statistically significantly different from test articles C, E, and D. ß Test article C was found to be statistically significantly different from test articles E and D. ß Test article E was found to be statistically significantly different from test article D. Table IV Analysis #4 Utilizing the first 10 days of the 21 consecutive days data Significant Comparisons (p0.05) N=41 Mean Total []]]]]•]]]'i'i'i]•[]f'"i ...... )[.. '..'•11•.].•'i•.•,• L•"-•i]-•i-'i-•]'•i'i-•].•]]]]]] ReactionScore [ 1.17 I 1.98 13.76 17.41 116.90 120.41 LSD Grouping • tMeans joined by the same grouping are not significantly different. Table V Analysis #5 Utilizing the first 7 days of the 21 consecutive days data Significant Comparisons (p0.05) N=41 Mean Total [J :•i""-i'": •"" •i]-•if]•]i'•11 • .•']]]•]i]•f•'•':':i•i-:• ....... i. -f•._. _._.•'=•-• ..... ReactionScore 1""0'-66 I i,• 12.Sl I "'4.80 [ 92i-0- 111.95 LSD Grouping • •Means joined by the same grouping are not significantly different.
Purchased for the exclusive use of nofirst nolast (unknown)
From: SCC Media Library & Resource Center (library.scconline.org)