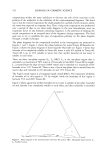
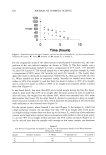
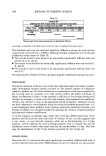
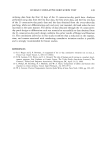
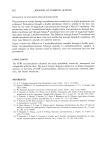
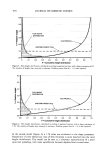
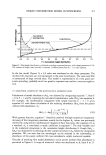
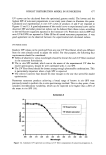
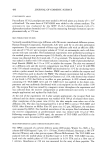
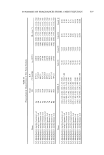
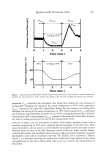
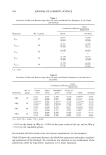
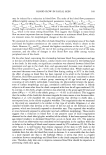
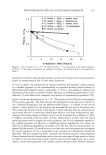
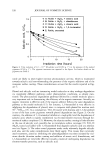
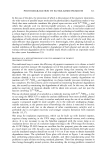
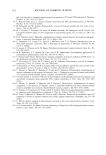
HEIGHT DISTRIBUTION MODEL IN SUNSCREENS 477 UV curves can be calculated from the optimized gamma model. The lowest and the highest SPF of sunscreen preparations in our study were chosen to illustrate this point. Calculated and experimental in vitro UV curves of products A and F are reported in Figures ! 2 and ! 3. A good adjustment of the model curve to experimental curve can be observed. SPF and other protection indices can be deduced from these curves, according to the well-known equations reported in the literature (! 5). Protection indices (SPF and ratio UVA/UVB) are reported in Table III for all tested sunscreen preparations. A very good agreement can be observed between the experimental and calculated indices. SPF PREDICTIONS Realistic SPF values can be predicted from any new UV filter blend, which are different from the ones already tested to adjust the model. For that purpose, the following four requirements should be considered: © Tables of absortivity versus wavelength should be known for each UV filter involved in the sunscreen formulation. © The in vitro SPF method, which was at the source of the experimental UV data for model optimization, should be well correlated with in vivo SPF. © The UV filter blend should be chosen among enough photostable combinations. This is particularly important when a high SPF is expected. © The selected cosmetic base should be close enough to the one that served for model optimization. Numerous sunscreen products achieving a broad range of known in vivo SPF were previously tested to perform the in vitro spectroscopy method. This is a key point, if one considers interlaboratory variability, which can be expected to be higher than +20% of the mean in vivo SPF (16). Sunscreen A 1,6 ........................................................ I 1,2 • 0,8 • 0.6 0,4. 0,2 ............................................... 0 ,,, , ...... , , 290 300 310 320 330 340 350 360 370 380 390 400 Wavelength Figure 12. Calculated UV spectrum according to UV filter composition of sunscreen preparation

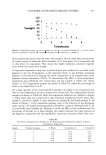
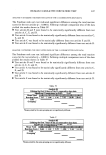
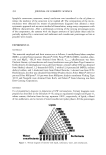
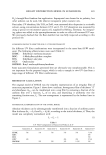
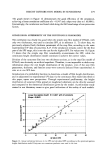
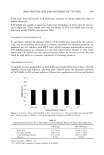
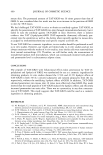
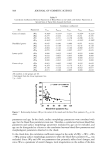
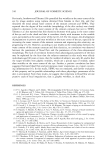
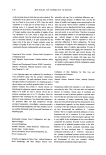
478 JOURNAL OF COSMETIC SCIENCE Sunscreen F • Experimental 1,4 1,2 • Model calculation m 1 0,6 0,4 0,2 0 290 300 310 320 330 340 350 360 370 380 390 400 Wavelength Figure 13. Calculated UV spectrum according to UV filter composition of sunscreen preparation F. Table III Comparison Between Experimental In Vitro Indices and Calculated Indices In vitro SPF Ratio UVA/UVB Experimental Calculated Experimental Calculated Sunscreen A 13.2 12.9 0.32 0.31 Sunscreen B 17.4 17.7 0.60 0.59 Sunscreen C 21.7 22.9 0.79 0.77 Sunscreen D 23.8 24.2 0.71 0.66 Sunscreen E 18.9 18.6 0.55 0.54 Sunscreen F 29.8 28.5 0.53 0.53 According to these requirements, calculated SPF, comparable to in vivo SPF, can be obtained. A very common O/W cosmetic base was used to formulate sunscreen products A-F. Thus, a lot of sunscreen formulations can be simulated in that way. To prove that the SPFs of 41 different sunscreen preparations were calculated through the gamma height distribution model, in order to be compared to the in vivo values. New UV filters were incorporated in the study they are called by their INCI names: ethylhexyl triazone, diethylhexyl butamido triazone, phenyl benzimidazole sulfonic acid, isoamyl p- methoxycinnamate, octocrylene, methylene bis-benzotriazoyl tetramethylbutylphenol (MBBT), bis-ethylhexyloxyphenol methoxyphenyl triazine (BEMT), and titanium diox- ide (TiO2). The in vivo SPFs were determined according to European protocol (COLIPA sun pro- tection factor test method). In some cases, instead of using ten volunteers, the studies were carried out with only five volunteers. A broad range of SPFs could be selected in order to test the model: minimum SPF = 3, maximum SPF = 57.
Purchased for the exclusive use of nofirst nolast (unknown)
From: SCC Media Library & Resource Center (library.scconline.org)