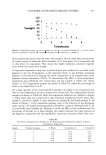
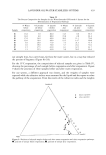
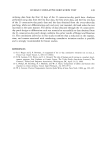
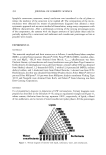
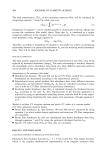
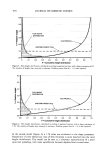
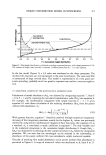
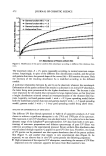
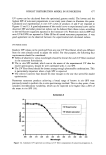
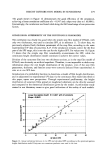
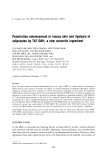
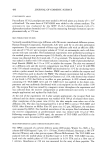
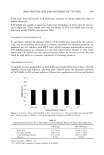
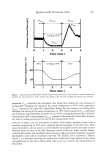
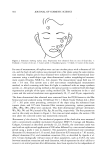
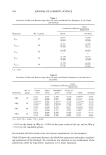
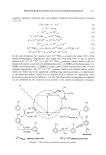
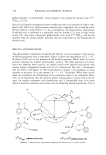
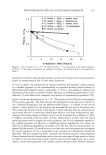
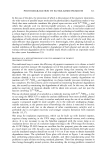
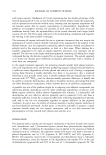
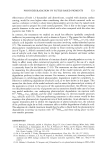
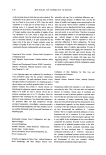
HEIGHT DISTRIBUTION MODEL IN SUNSCREENS 473 16 14 12 10 8 6 4, 0 290 300 310 320 330 340 350 Wavelength Sunscreen A --SunscreeiiiiiiiiliiiiCDESunscreenSunscreenSunscreen S__u.nscreen F 360 370 380 390 400 Figure 7. Parent uniform film absorbance curves (samples A-F), calculated for a spreading rate of 1.2 mg cm -2. 1,8 ........................................................................................................................................ -e- Sunscreen A • ............. .... ] --a-- Sunscreen B 1,6 ............................ • .............................................. 'l -e- Sunscreen C , . ...... .-•... J -•-Sunscreen D • 1,4 .-•-,-- ' ' '• ........................................ / +Sunscreen E • • ..... •.•-••_• I + Sunscreen F • •,2 • 0,8 '• 0,6 • 0,4 0,2 0 290 300 310 320 330 340 350 360 370 380 390 400 Wavelength (nm) Figure 8. Experimental UV curves (samples A-F), measured after a spreading rate of 1.2 mg cm -2 on roughened PMMA substrate. J I ß Flattening of the UVB part of the curve. Therefore, in vitro spectroscopy measures a higher UVA/UVB ratio than dilution spectroscopy (7,8). However, we can note that the rank of each UV curve (from low to high absorbance) remains unchanged in both graphs. A new graphic representation was chosen, similar to the one previously used to analyze the mathematical film models. Pairs of UV data, experimental in vitro absorbance (Aexp) x vs parent uniform film absorbance Ax, were formed at each wavelength, and plotted in Figure 9. Therefore, a relationship between spectroscopy in dilution (regular

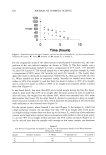
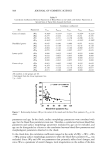
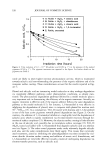
474 JOURNAL OF COSMETIC SCIENCE m 2,5 .o 2 .i • 1,{5 E .I e 1 ii • 0,{5 ß Sunscreen A ß Sunscreen B zx Sunscreen C ......................................................................................................... _ Gamma model with c = 1.5 x Sunscreenu , ß Sunscreen E I '•----------------•- © SunscreenF [ Gamma c = 1.5 ß ß ß ß ß ß ß ß ß i 0 2 4 6 8 10 12 14 16 18 20 A = Absorbance of Parent uniform film Figure 9. Experimental absorbance vs parent uniform film absorbance. Pairs of data were collected from sunscreens A-F, according to each studied wavelength. film) and spectroscopy in vitro (irregular film) can be assessed. AccoMing to the 23 sets of absorbance data, collected for each single sunscreen scan (290 to 400 nm, 5-nm increment steps), 138 pairs can be formed with the six sunscreen products. Figure 9 is a good example of experimental plot distribution, based on this type of UV graph. Both theoretical curves, based on gamma distribution with c = 0.5 and c = 1.5, are also reported on the same graph. We can note that all the individual data plots are well grouped and seem disposed around a single curve, whichever wavelength and sunscreen preparation is considered. Moreover, the shape of these experimental data plots is also remarkably similar to the shape of the mathematical curves previously studied. Therefore, the same kind of nonlinear relationship, already deduced from the theoretical models of sunscreen film distribution, can be experimentally assessed. As previously, the nonlinear relationship means that fragmentation of the uniform parent film results in a decrease in its potential UV absorbance, accoMing to absorption intensity. The decrease in the high UV absorption range is more intense than in the low UV absorption range. The 138 experimental data plots of sunscreens A-F are gathered just below the theo- retical gamma model curve with c = 1.5 (good spreading model). The result is obviously specific to the peculiar type of sunscreen vehicle used in our study (a normal O/W emulsion) and also depends on the in vitro spectroscopy requirements. We can also note that the efficiency of sunscreen vehicles can be assessed through the graph, mainly if the in vitro SPF is well correlated with the in vivo SPF. As an example, bad vehicles will achieve a lower set of experimental data plots, close to the model curve with c = 0.5. ADJUSTMENT OF THE CONTINUOUS FILM MODEL TO EXPERIMENTAL DATA The irregular film model, based on gamma height distribution, should be adjusted to achieve, for each data set, the smallest possible difference between experimental in vitro
Purchased for the exclusive use of nofirst nolast (unknown)
From: SCC Media Library & Resource Center (library.scconline.org)