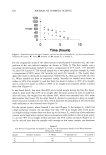
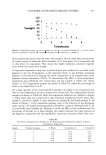
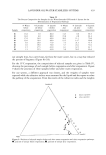
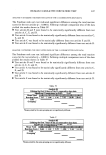
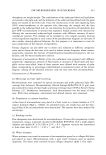
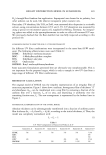
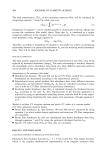
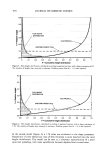
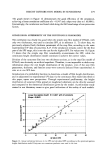
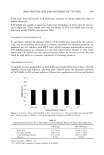
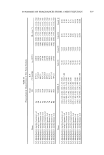
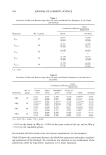
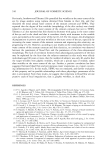
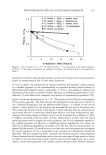
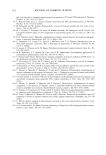
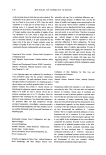
HEIGHT DISTRIBUTION MODEL IN SUNSCREENS 475 absorbance (Aexp)x and model absorbance (As)x, the latter being calculated according to parent film absorbance Ax. The shape parameter of the gamma function, from which the film geometry can be deduced, was adjusted through the 138 experimental sets of data of sunscreen preparations A-F. The final fit to the experimental data was determined by least-squares error assessment (equation 11): n=138 1 Amodel-- 1•8 x Z [(A:xp)X- (A•)X] 2 = minimum (11) An example of data treatment through Excel spreadsheet is given in Table II, with the 23 sets of UV data for sunscreen A. Every model absorbance data (As)x is calculated through numerical integration of equation 7 in which hv ) = inverse of gamma function, from F = 0 to F = 1. Total square error Arnodel , which is the sum of individual square errors (Aexpx-Asx) 2, should at least be reduced. This is accomplished by adjusting the shape parameter "c" via Excel Solver © (spreadsheet optimizer). As a matter of fact, all the 138 examples of suitable sunscreen data, from samples A to F, were finally added to the spreadsheet. According to this method, the film height distribution was successfully optimized, achieving a good correlation coefficient of 0.9960 with the experimental UV data, for a shape parameter of 1.105 (Figure 10). Table II Example of Spreadsheet Presentation with Absorbance Data of Sunscreen A Absorbance data Ax (Aexp)x (As)x hmode 1 Wavelength Parent film Experimental Calculated Square error 290 8.0100 1.4025 1.3869 0.0002 295 8.1437 1.4325 1.3944 0.0015 300 8.1388 1.3975 1.3942 0.0000 305 8.3059 1.3885 1.4034 0.0002 310 8.5248 1.4070 1.4153 0.0001 315 8.1676 1.3660 1.3958 0.0009 320 7.2331 1.3217 1.3407 0.0004 325 5.8371 1.2411 1.2446 0.0000 330 4.3124 1.1053 1.1115 0.0000 335 2.9423 0.9339 0.9487 0.0002 340 1.9024 0.7719 0.7731 0.0000 345 1.2263 0.6367 0.6114 0.0006 350 0.8006 0.5195 0.4726 0.0022 355 0.5245 0.4123 0.3554 0.0032 360 0.3326 0.3114 0.2534 0.0034 365 0.2042 0.2125 0.1708 0.0017 370 0.1188 0.1505 0.1067 0.0019 375 0.0682 0.0947 0.0643 0.0009 380 0.0380 0.0560 0.0371 0.0004 385 0.0211 0.0345 0.0211 0.0002 390 0.0115 0.0271 0.0118 0.0002 395 0.0067 0.0111 0.0071 0.0000 400 0.0036 0.0036 0.0040 0.0000 Total square error: 0.0183. Shape parameter: 1.105.

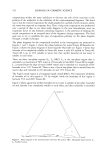
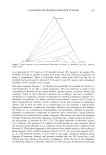
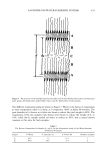
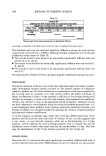
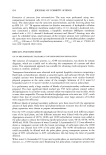
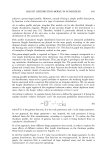
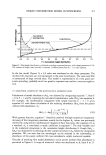
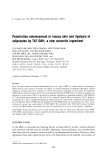
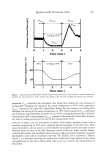
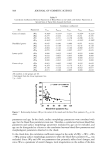
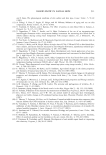
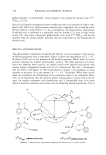
476 JOURNAL OF COSMETIC SCIENCE 1,6 • 1,4 g 4,2 '- 0,8 • 0,6 ,,-, 0,4 0,2 0 ß Experimental data ---Optimised Gamma function ß • , T 4 6 8 10 12 14 16 Absorbance of Parent uniform film Figure 10. Comparison between experimental data from sunscreen products A-F and the final fit calculated through the optimized gamma function. The resulting film profile is shown in Figure 11. As expected, a strongly skewed distribution resulted from the adjusted film model, taking into account the expected film spreading consequences: sunscreen depletion in the upper regions of the roughened substrate, with a high probability of finding a very thin film, and sunscreen accumu- lation into the valleys, with a broad distribution of all possible film thicknesses. 5,0 4,5 4,0 e 3,0 • , ' ........... .FILM HEIGHT . ._/.._ .- 2,5 - .... ../ • ........ FILM PROFIL 13:: 2,0 ........ II 1,0 0,5 - 0,0 0 0,1 0,2 0,3 0,4 0,5 0,6 0,7 0,8 0,9 F = Cumulative height distribution Figure 11. Film height distribution, calculated from the optimized gamma function. The number of height class intervals is arbitrary. Probability density data is twice the normal value.
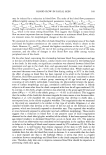
Purchased for the exclusive use of nofirst nolast (unknown)
From: SCC Media Library & Resource Center (library.scconline.org)