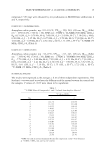
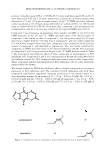
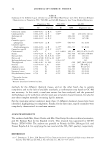
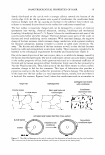
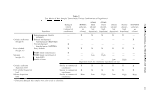
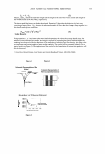
SKIN WHITENING BY A. DAHURICA EXTRACTS 15 compound 2 (94 mg) were obtained by recrystallization in MeOH from subfractions 2 and 4, respectively. COMPOUND 1 (ISOIMPERATORIN) Amorphous white powder mp: 101-103°C UVm ax : 220, 249, 309 nm IR max (KBr) cm- 1 : 2950 (C-H), 1720 (C = O) EIMS rn/z: 270[M+} 1 H-NMR (500 MHz, CDC1 3 ) o H : 8.15 (lH, d,J = 9.76 Hz, H-4), 7.60 (lH, d,J = 2.45 Hz, H-2'), 7.16 (lH, s, H-8), 6.96 (lH, d,J = 2.45 Hz, H-3'), 6.27 (lH, d,J = 9.76 Hz, H-3), 5.54 (lH, m, H-2"), 4.92 (2H, d,J = 6.99 Hz, H-1"), 1.81 (3H, s, H-5"), 1.71 (3H, s, H-4")) 1 3 C-NMR (75 MHz, CDC1 3 ) o c (Table I). COMPOUND 2 (IMPERATORIN) Amorphous white powder mp : 95-97°C UVmax : 217, 247, 298 nm IR m ax (KBr) cm - i : 2950 (C-H), 1720 (C = 0) EIMS rnlz : 270[M+} 1 H-NMR (500 MHz, CDC1 3 ) o H : 7.76 (lH, d,J = 9.60 Hz, H-4), 7.69 (lH, d,J = 2.21 Hz, H-2'), 7.36 (lH, s, H-5), 6.81 (lH, d,J = 2.21 Hz, H-3'), 6.36 (lH, d,J = 9.60 Hz, H-3), 5.62 (lH, m, H-2"), 5.01 (2H, d, J = 7.16 Hz, H-1"), 1.75 (3H, s, H-5"), 1.72 (3H, s, H-4") 1 3 C-NMR (75 MHz, CDC1 3 ) o c(Table I). STATISTICAL ANALYSIS The results were expressed as the averages ± S.D. of three independent experiments. The Student's t-test was used to evaluate the differences of the means between the control and the samples. P values of 0.05 were taken to be significant. Table 1 13 C-NMR Data of Compounds 1 and 2 Isolated from Angelica dahurica* 13 C (0) in CDG'l No. 2 2 161.26 160.50 3 112.55 114.68 4 139.55 144.31 5 148.95 113.12 6 114.20 125.84 7 158.12 148.61 8 94.21 131.67 9 152.66 143.82 10 107 .52 116.47 2' 144.87 146.60 3' 105.02 106.69 1" 69.74 70.14 2" 119.09 119.76 3" 139.80 139.71 4" 18.20 18.09 5" 25.79 25.79 * TMS was used as internal standard the data for compounds 1 and 2 were obtained at 75 MHz. CDC1 3 was used as the solvent.

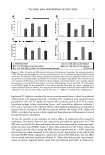
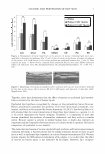
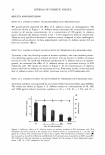
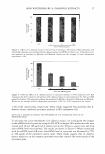
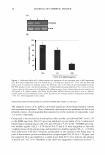
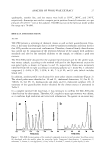
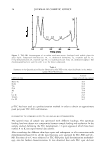
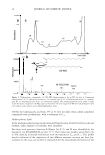
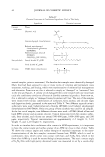
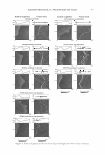
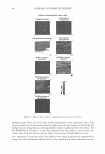
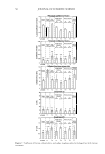
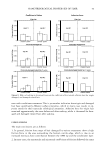
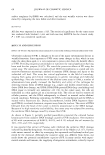
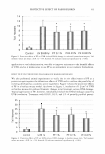
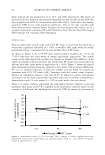
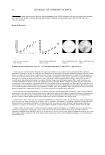
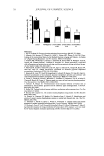
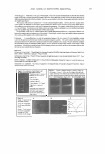
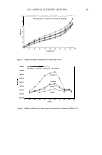
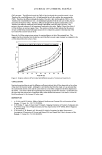
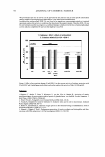
16 JOURNAL OF COSMETIC SCIENCE RESULTS AND DISCUSSION EFFECT OF A. DAHURICA EXTRACT ON MELANOGENESIS IN B16 MELANOMA CELLS We quantitatively examined the effect of A. dahurica extract on melanogenesis. The results are shown in Figure 1. A. dahurica extract decreased the intracellular melanin content at all testing concentrations. At a concentration of 100 µg/ml, A. dahurica extract decreased the melanin content to 68 ± 2.5% compared to those of control cells. These are very significant decreases in melanin content compared to other melanogenic inhibitors such as arbutin. In these experimental conditions, A. dahurica extract did not have any cytotoxic effects. EFFECT OF A. DAHURICA EXTRACT ON THE ACTIVITY OF TYROSINASE IN 816 MELANOMA CEil.S Tyrosinase is the rate-limiting enzyme in melanin synthesis, and some melanin produc- tion-inhibiting agents such as arbutin and kojic acid are known to inhibit tyrosinase activity (15,16). To clarify the inhibitory mechanism of A. dahurica extract on melano- genesis, we examined the effect of A. dahurica extract on tyrosinase activity in B16 melanoma cells. The results are shown in Figure 2. At all concentrations, A. dahurica extract exhibited no influence on tyrosinase activity. From these results, it was indicated that A. dahurica extract did not inhibit tyrosinase activity in B16 melanoma cells. EFFECT OF A. DAHURICA EXTRACT ON THE SYNTHESIS OF TYROSINASE IN 816 MELANOMA CELLS Tyrosinase synthesis was examined by an enzyme-linked immunosorbent assay (ELISA). The results are shown in Figure 3. A. dahurica extract at concentrations of 50, 100, and 1000 µg/ml reduced tyrosinase synthesis to 56 ± 1.5%, 43 ± 1.5%, and 18 ± 120 110 100 80 � ::1. � .!!!. 90 CD C: � 60 0 0 � u C: :c ·2 40 5 CD 70 20 50 0 Ctrl 10 100 Arbutin Cone. of A. dahurica (µg/ml) Figure 1. Inhibitory effects of A. dahurica extract on melanin synthesis in Bl6 melanoma cells. Bl6 melanoma cells were cultured in the presence of A. dahurica extract at concentrations of 1, 10, and 100 µg/ml for 72 hours. The concentration of arbutin was 2 mg/ml. The determination of melanin content (■) was measured as described in Materials and Methods. Cell cytotoxity was measured by an MTT assay ( ♦ ). The viability of cells was expressed as a percentage. Results are the averages of three independent experi- ments ± SD. *p 0.05 compared to the control.
Purchased for the exclusive use of nofirst nolast (unknown)
From: SCC Media Library & Resource Center (library.scconline.org)