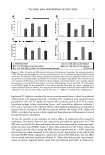
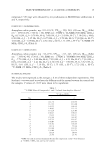
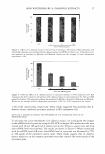
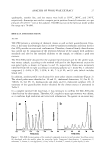
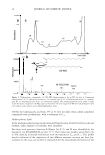
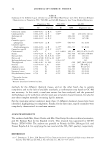
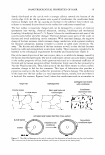
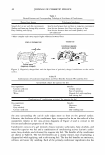
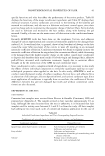
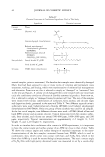
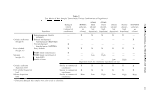
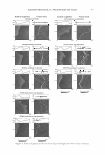
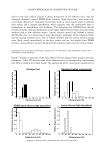
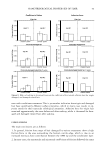
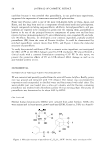
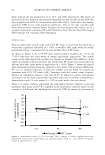
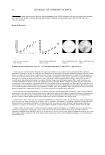
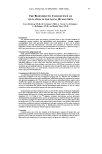
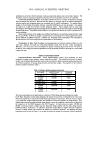
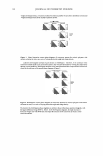
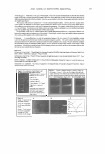
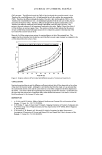
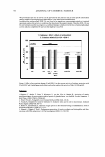
2005 ANNUAL SCIENTIFIC MEETING performed on all wells of the 96-well plate, with an average total analysis time of less than 2 minutes. The absorbance units are reported and plotted as a function of% actives polymer and% actives surfactant. Coacervate Structural Analysis: Association colloids can exist in a variety of structures, including liquid crystalline-like structures. Micellar and cubic phases are isotropic and do not exhibit birefringence, whereas lamellar and hexagonal phases are anisotropic and do exhibit birefringence. To rapidly analyze samples in 96-well plates for possible structure, a pass/fail birefringence test was developed. The samples are placed on a light box between crossed polarizing sheets. Those samples that do rotate light (birefringent) show light through the polarizing sheets and samples that do not rotate light are black through the polarizing sheets. The pass/fail results of this test are reported as a function of% actives polymer and% actives surfactant. More detailed analysis of the samples that exhibited birefringence was performed using Polarized Light Microscopy (PLM). In PLM, the sample is placed between crossed polarizers and the magnification allows for the definition of different structures. Lamellar and hexagonal liquid crystal phases were identified by the characteristic focal conic images that are representative of each structure. Visualization of Data: High throughput screening generates an enormous amount of data in a very short time. Analysis Of results by conventional methods would slow the pace of the investigation. Therefore, it was necessary to devise techniques for quickly visualizing large arrays of data. We chose to do this by color-coding our measured parameters and by presenting the data in the form of a color-coded composition map. RES UL TS AND DISCUSSION Polymer-Surfactant Interactions. Initial high-throughput studies were performed on three component systems cationic polymer, anionic surfactant and water. This established a baseline for further studies (e.g. electrolyte effects) and also can be used as a predictive model coacervate amount and structure for cellulosic pol ym ers of varying charge densities and molecular weights. The properties of the cellulosic polymers studied are shown in Table 1. T l IC . abe attomc ce ll I u os1c po1vmer properties POLYMER MOLECULAR CHARGE WEIGHT DENSITY UCARE LK 350,000 0.357 UCARE 350,000 0.678 LR400 UCAREJR125 350,000 1.321 UCAREJR400 450,000 1.321 UCARE 1,800,000 0.678 LR30M UCARE 2,000,000 1.321 JR30M The coacervate amount varies significantly as a function of both charge density and molecular weight. In the Phase Separation contour phase diagrams, the amount of coacervate is indicated by the color scale, where blue represents no coacervate and red means high amounts of coacervate. From the results in Figure 1, low molecular weight polymers produce low amounts of coacervate regardless of charge density. At a slightly higher molecular weight and high charge density, coacervate formation is increased as evidenced by the comparison of the JR400 diagram to the JR125 diagram. At high molecular weights, LR30M and JR30M, coacervate amount is higher than low molecular weight systems with the same charge density, LR400 and JR125, respectively. In addition to molecular weight effects, at higher molecular weights an increase in charge density also increases the amount of coacervate produced. By mapping the phase separation results as done in Figure 1, we are able to predict the amount of coacervate if given a molecular 81

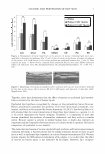
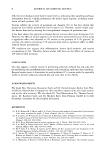
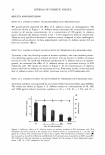
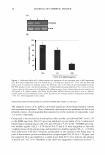
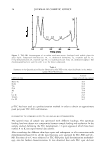
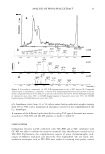
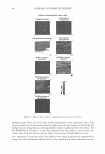
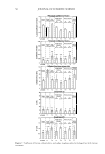
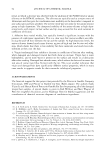
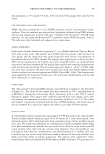
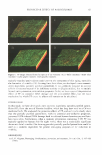
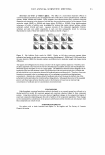
82 JOURNAL OF COSMETIC SCIENCE weight and charge density, or if given an unknown cellulosic polymer we are able to determine its molecular weight and charge density from its phase separation profile. J :�� -- ··1 i1' .. I I' . . . ·- -·- Figure I. Phase Separation contour phase diagrams of coacervate amount for cationic polymers with anionic surfactant in water, as a series of varying molecular weight and charge density. Lamellar and hexagonal lyotropic liquid crystals are birefringent. Therefore, if the surfactant in the coacervate formed liquid crystal association spatters, they would be detectable by viewing the sample array through crossed polarizers. Birefringent structures were indeed found and their compositional locations are shown by the red-areas of the pseudo-phase diagrams of figure 2 Figure 2. Birefringence contour phase diagrams of coacervate structure for cationic polymers with anionic surfactant in water, as a series of varying molecular weight and charge density. The trends in the birefringence phase diagrams are similar to those in the phase separation diagrams, with the largest difference being JR400 vs. JR125. In the birefringence diagrams, the slight increase in molecular weight seen with JR400 does not impact the structure of the coacervate as much as it did coacervate amount.
Purchased for the exclusive use of nofirst nolast (unknown)
From: SCC Media Library & Resource Center (library.scconline.org)