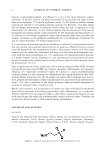
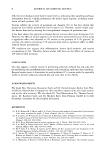
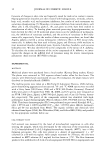
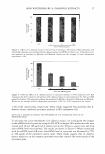
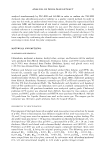
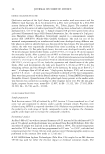
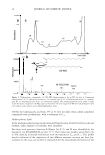
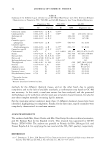
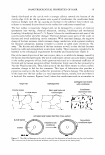
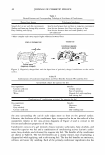
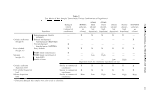
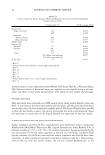
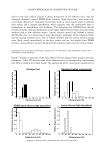
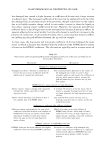
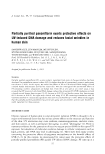
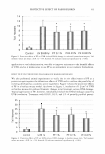
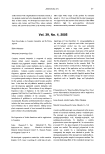
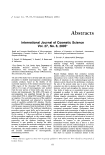
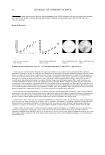
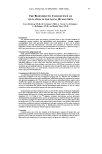
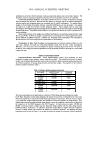
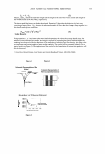
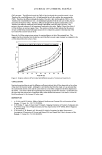
28 0.0 JOURNAL OF COSMETIC SCIENCE 10 11 D.1 0.2 0.3 T1me (min) 0.4 16 0.6 Figure 2. TLC-FID chromatogram of an amber wool-wax extract developed with mobile phase for polar lipids. Compound identification: 10, 11, cholesterol derivatives 12, ceramide type II 13, (7)-hydroxycholesterol 14, ceramide type VI 15, hydroxyacids and dials 16, cholesterol sulphate. The chromatogram has been scaled in order to see the minor compounds. Table I Summary of the Quantification Results Obtained by TLC-FID of the Identified Peaks in the Amber (polar) Wool-Wax Extract Chemical class Mono-Es Di-Es TG FFA AL s Cer II 70H-S Cer VI Content (mg/g of wool wax extract) 39.5 50.8 81.5 93.4 79.9 69.0 24.5 99.6 56.7 p-TLC has been used as a prefractionation method in order to obtain an approximate peak per peak TLC-FID confirmation. PREPARATIVE TLC COMBINED WITH TLC-FID AND GC-MS DETERMINATION The spotted mass of sample was optimized with different loadings. The optimum loading level was chosen as a compromise between sample loading and resolution. In the sample studied, following the TLC development, 11 spots appeared, which have been named A to K (see experimental data above). After scratching the different thin-layer spots and subsequent to silica extraction with chloroform/methanol (2/1), all the lipid fractions were analyzed by TLC-FID and GC- MS. Fractions A to C were subjected to TLC-FID polar lipid determination methodol- ogy, also for further characterization. It was observed that each TLC spot did not

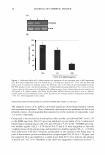
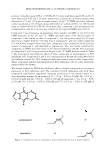
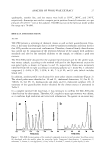
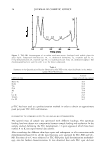
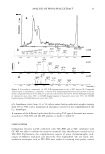
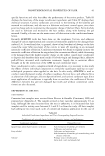
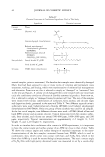
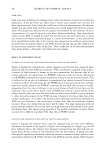
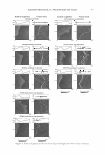
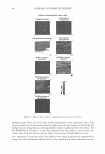
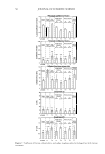
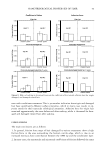
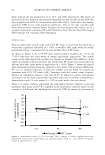
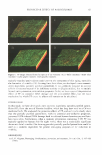
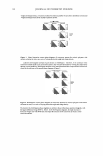
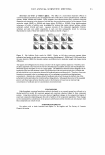
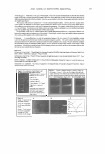
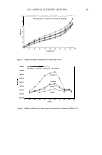
ANALYSIS OF WOOL-WAX EXTRACT 29 correspond to a single TLC-FID peak. It means that not only compounds from a single family were present, but, at least, a clear enrichment has been seen in each fraction. Therefore, peaks present in the different fractions were identified as described above. Characteristic TLC-FID chromatograms for non-polar and polar lipids are shown in Figures 1 and 2. As expected, similar retention behavior was observed in p-TLC and in TLC-FID, allowing peak confirmation. In this way, to identify the constituents of the different lipids, GC-MS diagnostic ions of the fatty acids, fatty alcohols, hydroxyacids, diols (18), aliphatic esters (19), steryl esters (20), and ceramide type II (24,25) in the EI and CI modes have been used. The different lipid fractions obtained by p-TLC were classified according to their polarity as high-polarity compounds (lipids from spots A, B, and C), medium-polarity compounds (lipids from spots D, E, F, G, and H), and low- polarity compounds (lipids from spots G, H, I, J, and K). High-polarity lipids As expected, the first three fractions (A, B, and C) of the p-TLC contained the most polar compounds. Cholesteryl sulphate and ceramide type VI, due to their high polarity, could not be determined by GC-MS. In TLC-FID, they appeared in the first three fractions. In Figure 3a, a characteristic TLC-FID chromatogram for fraction A is shown. In these polar fractions, apart from cholesteryl sulphate, cholesterol oxidation products such as diols and ketones also appeared. Several cholestanediols were identified in fractions A and B by GC-MS using [M.+} (m/z 546), [M-CH3f (m/z 531), and [M-TMSHf (m/z 456). Two chemical classes were identified as ketones: those derived from cholesterol itself such as 7-cholestanone [M• +} (m/z 382) and the others coming from the cholestanediols with [M.+} (m/z 472), which have both a hydroxy group and an additional ketone functional group. These ketones were found in fraction C. Ceramides (type II), probably as part of the wool internal lipids, have also been identified by means of TLC-FID and GC-MS in fractions A and B. Even though this chemical class appeared as a single peak in the TLC-FID, in fact it was constituted by two slightly different chemical classes. Also for the first time, ceramides type II have been fully characterized in a wool-wax sample. In this way, two different bases forming these ceramides were observed by GC-MS, sphingosine, and dihydrosphingosine, which were combined with different acid chains containing an even carbon number (C 16 , C 18 , C 20 , C 22 , C 24 ). Characteristic ions for these families are m/z 311 for the sphingosine bases and m/z 313 for the dihydrosphingosine bases (24). A mass spectrum of C 16 dihydrosphin- gosine is shown in Figure 36. Also, the acid chain fragment was identified according to the ion (CH 3 -(C 0 _ 2 H 2 0 _ 2 ))-CO-(NH-CH-CH2-OTMSt}, and molecular weight was assigned from the ion [M-15 +} and from the sum of the base and acid fragments. The molecular weight distribution ranged from 681 to 793 for the sphingosine and from 683 to 795 for the dihydrosphingosine, the homologue series containing the C 16 acid chain being predominant, as can be seen in Figure 4. Also, the 1,2-hydroxyacids and 1,2-diols were identified as high-polarity compounds in fractions A, B, and C. No standard solution was available, and therefore these two chemical classes, appearing as a single peak in TLC-FID, could not be identified without GC-MS, where they show a diagnostic ion, once silylated, at m/z 147 corresponding to [(CH 3 )2Si+OSi(CH 3 ) 3 }. For the two chemical classes, a molecular weight distribution ranging from C 14 to C24 was obtained, and the molecular weight ranged from 388 to
Purchased for the exclusive use of nofirst nolast (unknown)
From: SCC Media Library & Resource Center (library.scconline.org)