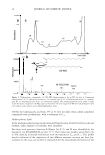
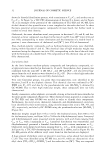
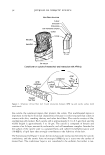
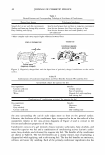
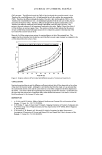
NANOTRIBOLOGICAL PROPERTIES OF HAIR 45 longitudinal axis of the fiber. The tip was centered over the cross section in order to be at the very top of the fiber, so as to negate effects caused by the AFM tip hitting the sides of the hair and adding error to the measurements. In order to minimize scanning artifacts, a scan rate of 1 Hz was used for all measurements. Topographical images to characterize the shape and structure of the various hair specimens were taken at 5 x 5 and 10 x 10 µm2 scans at a normal load of approximately 5 nN. These scan sizes were suitable for capturing the surface features of multiple scales and scale edges of the cuticle. To characterize roughness, 2 x 2 µm2 scans of the cuticle surface without edges were used. Friction force mapping of the scan area was collected simultaneously with rough- ness mapping. A quantitative measure of friction force was calculated by first calibrating the force based on a method by Bhushan (15,16). The normal load was varied from 5 nN to 45 nN in roughly 5-nN increments, and a friction force measurement was taken at each increment. By plotting the friction force as a function of normal force, the average coefficient of friction was determined from the slope of the least-squares fit line of the data. For the macroscale coefficient of friction, the tests were conducted using a flat-on-flat rribometer under reciprocating motion, using polyurethane film as an upper specimen to simulate skin. The coefficient of friction values for the various hair specimens were then indexed against the reference values available for damaged treated hair. Surface roughness images shown in this study were processed using a first-order plane/it command available in the AFM software, which eliminates tilt in the image. Roughness data as well as friction force data were taken after the plane/it command was employed. A first-order flatten command was also used on friction force mappings to eliminate scanning artifacts and to present a cleaner image. ADHESIVE FORCE MEASUREMENTS Adhesive force measurements were made with square pyramidal Si 3 N4 tips attached to the end of an Si 3 N4 cantilever beam (spring constant of 0.58 Nim), using the "force calibration plot technique." In this technique, the AFM tip is brought into contact with the sample by extending the piezo vertically, then retracting the piezo and calculating the force required to separate the tip from the sample. The method is described in detail by Bhushan (15-18). The force calibration plot allows for the calculation of an adhesive force at a distinct point on the sample surface. Consequently, by taking a force calibration plot at discrete sampling intervals over an entire scan area, a resulting adhesive force mapping (also known as force-volume mapping) can be created to display the variation in adhesive force over the surface (19). In this work, plots were taken at 64 x 64 distinct points over a scan area of 2 x 2 µm2 for all hair types and ethnicities. Current Digital Instruments software for the Multimode AFM does not allow direct calculation of the adhesive force from the force-volume maps. Thus, a custom program coded in Matlab was used to display the force-volume maps. The adhesive force for each force calibration plot was obtained by multiplying the spring constant with the horizontal distance (in the retract mode) traveled by the piezo from the point of zero applied load to the point where the tip snaps off.

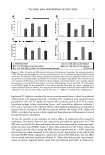
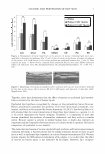
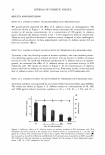
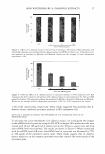
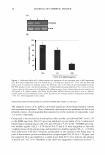
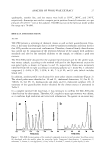
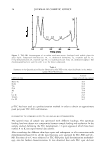
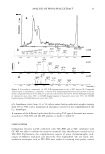
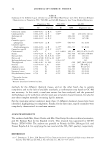
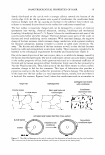
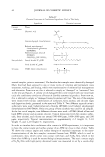
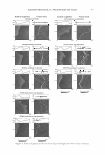
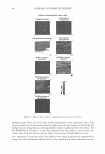
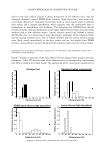
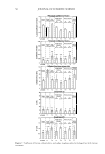
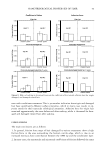
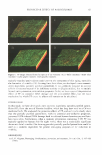
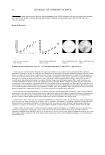
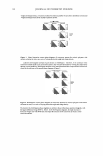
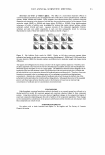
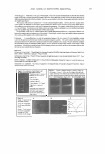
46 JOURNAL OF COSMETIC SCIENCE SOAK TESTS Soak tests were performed on damaged hair, with and without commercial conditioner application. A dry hair fiber was taken from a switch, and a sample was cut from the fiber (approximately 7-mm long) for coefficient of friction measurements. An adjacent sample was also taken from the fiber and placed in a small beaker filled with de-ionized water. The sample was subjected to the aqueous environment for five minutes, which is representative of a typical exposure time when showering/bathing, then immediately analyzed with AFM. It should be noted that hair becomes saturated when wet in about one minute and remains saturated if kept in a humid environment. It was determined from unpublished results that if the wet hair was exposed to the ambient environment for more than 20 minutes while in the AFM, the hair became dry and the coefficient of friction became similar to that of dry hair. Thus, coefficient of friction measurements were made within a 20-minute time frame for each sample. RESULTS AND DISCUSSION SURFACE ROUGHNESS AND FRICTION FORCE MAPS OF VARIOUS HAIR SAMPLES Figure 4 displays the representative surface roughness and friction force maps for dam- aged hair and the seven different treatments. When conditioner is applied to the surface, a pattern of high friction is shown in the area surrounding the bottom edge of the cuticle. Likewise, the application of a BTMAC surfactant (with no silicone deposition) or a BAPDMA surfactant (no silicone deposition) results in similar friction features. This is believed to be an area of conditioner accumulation that causes increased friction due to meniscus effects. Friction maps for the PDMS blend of silicone (at both low and high deposition levels) added to the BTMAC surfactant do not show this increase as readily, suggesting that this type of silicone is not a contributor of high friction force on the nanoscale. This can be due to the fact that a PDMS-type silicone is fairly mobile on the surface and thus does not cause the same meniscus effects as the AFM tip rasters through it. Also, the surface energy of the PDMS silicone is believed to be lower than that of the cationic surfactants. As a result, the meniscus force affecting the friction between the AFM tip and silicones in the conditioner is lower than that of conditioner without silicones. Thus, the overall friction force will be lower. For high deposition levels of amino silicone, however, we see that there is a high variation of friction force and a more distributed layer. The amino group typically is less mobile and harder to move, which accounts for a different slip plane flow than that of PDMS silicone. FORCE VOLUME (ADHESIVE FORCE) MAPS OF VARIO US HAIR SAMPLES Figure 5 displays the adhesive force maps for damaged hair and the seven different treatments. As shown in the legend, a lighter area corresponds to a higher tip pull-off force (adhesive force). We observe that damaged untreated hair has relatively low ad- hesive force, which is more or less consistent over the hair surface. In nearly all cases, addition of a conditioner treatment caused an increase in meniscus forces, which in turn increased the adhesive pull-off force between the AFM tip and the sample. Observing the
Purchased for the exclusive use of nofirst nolast (unknown)
From: SCC Media Library & Resource Center (library.scconline.org)