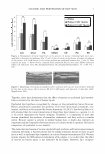
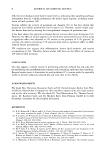
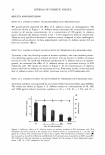
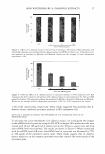
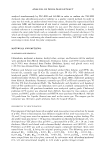
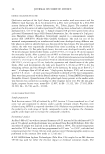
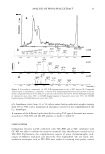
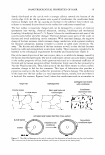
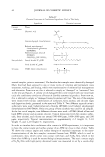
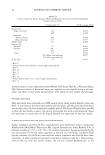
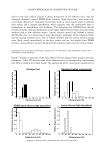
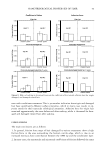
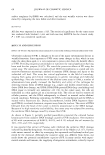
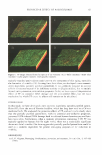
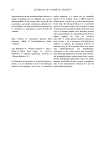
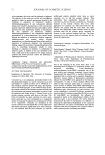
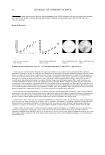
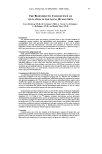
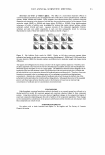
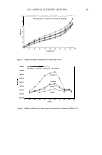
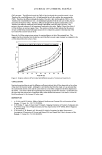
32 JOURNAL OF COSMETIC SCIENCE showed a bimodal distribution pattern, with a maximum at C 20 -C21 and another one at C 26 -C 27 . In Figure Sa, a TLC-FID chromatogram of fraction E is shown, and in Figure Sb, as an example of the potential of the combination of TLC-FID and GC-MS, fatty alcohol chemical class quantification is now completed at the molecular level. In these fractions, potential anticarcinogenic compounds ( 4) were found, but further work is needed to reveal their identity. Cholesterol, the most abundant sterol, was present in fractions C, D, and E, and des- mosterol, a minor compound, was found in fractions C and D. Ions [M.+} (m/z 458 and m/z 368), corresponding to water elimination and the formation of a double bond in position 3 were characteristic of cholesterol, and [M.+} (m/z 456) of desmosterol. Also, medium-polarity compounds, such as hydroxycholesteryl esters, were identified, eluting within fractions F and G. This chemical class of high molecular weight was monitored using the diagnostic ion (m/z 456), corresponding to the loss of the acid chain with the formation of a double bond. The components of this chemical class are not yet fully characterized. Low-polarity lipids At the limit between medium-polarity compounds and low-polarity compounds, tri- acylglycerols were identified in fractions G, H, and I. Nevertheless, their presence was confirmed with the ions [M.+}, [M-CH 3 r, and [M-Cncoor, and also several frag- ments from the acid moieties were observed as [C n =or. Due to their high molecular weights, these compounds were not fully characterized. Two ester functional groups, less polar than triacylglycerols, were identified in the fractions J and K as the aliphatic diesters. This chemical class was confirmed by GC- EIMS ions [C n =O+} and also by the pseudomolecular ions [M+NH 4 +}, obtained by GC-PCIMS. Due to their high molecular weight, these compounds were not fully characterized. Finally, monoesters, either aliphatic or steroidal, eluting in fraction K were identified as the most apolar compounds (Figure 6a). These chemical classes appeared as a single peak in TLC-FID, and thus GC-MS was needed in order to identify their components. Furthermore, the steryl esters, cholesteryl, lanosteryl, and dihydrolanosteryl esters have been identified by their sterol moiety, using electron impact ions at m/z 368, 393, and 395, respectively, and also by GC-PCIMS using the pseudomolecular ions [M+NH 4 +} (Figure 66). Molecular weights ranged from 554 to 722 for the cholesteryl esters, from 580 to 762 for the lanosteryl esters, and from 582 to 7 64 for the dihydrolanosteryl esters. Lanosteryl and dihydrolanosteryl esters presented similar patterns, with acid chains ranging from C 10 to C 23 , with a maximum at C 1 6 . Lanosteryl distribution was monomodal, and dihydrolanosteryl presented a bimodal distribution with a minor maximum at C 1 4 . Cholesteryl esters showed acid chains ranging from C 11 to C 23 , with a maximum at C 19 . In Figure 6a, a TLC-FID chromatogram of fraction K is shown, and in Figure 66, the GC-MS patterns of the different steryl esters found in this fraction are displayed. A huge amount of aliphatic esters are present in wool wax, as has already been described (7,20). They were identified using GC-MS ions, m/z 85, which are characteristic of an alkyl chain [CH 3 -(CH 2 ) n -COOH2+} and the molecular ion [M+}. They are composed

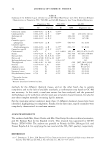
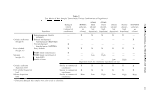
! a ,u 28.00 29.00 ANALYSIS OF WOOL-WAX EXTRACT 1 3 30.00 31.00 32.00 3300 34.00 15:30 35.00 ;-- 36.00 m/z368 mlz393 jsl C � t 16:30 ·� /\. � T0 1s:3o �j.,___l ��=r��=;c.......,����UG��i��-----'J'---'r--/, --"- iL2� =,7=,���==�=:3=0==�c-;-�-= 28.00 29.00 30.00 31.00 32.00 33.00 34.00 35.00 36.00 mlz395 d m,30� � o � o �o ·��.,.......,.., -q,-�=4=,-,�JlJU�--.=.+M----}_/\--,,--A�=-\. -,.0 ���-----�....,_...,__.., 33 28.00 29.00 30.00 31.00 32.00 33.00 Time (min) Figure 6. Low-polarity compounds. (a) TLC-FID chromatogram of the p-TLC fraction K. Compound identification: 1, monoesters 2, unknown 3, diesters. The chromatogram has been scaled in order to see the minor compounds. Pattern of the different steryl esters ident:ified in fraction K. (b) GC-MS fragmentogram of cholesteryl esters (m/z 368). (c) GC-MS fragmentogram of lanosteryl esters (m/z 393). (d) GC-MS fragmentogram of dihydrolanosteryl esters (m/z 395). 34.00 35.00 36.00 of a homologue series from 33 to 54 carbon atoms having molecular weights ranging from 550 to 788, with a maximum of abundance centered in the neighborhood of the C4 7 homologue. A summary of the different lipids identified in each p-TLC spot of the wool-wax extract, according to TLC-FID and GC-MS analysis, is shown in Table II. CONCLUSIONS Comparison between p-TLC combined with TLC-FID and p-TLC combined with GC-MS was able to confirm the tentative chemical class identification carried out by TLC-FID. Furthermore, the complementary aspects of using chromatographic tech- niques of different resolution and selectivity were highlighted. On one hand, low- resolution techniques such as TLC-FID were useful as screening and quality control
Purchased for the exclusive use of nofirst nolast (unknown)
From: SCC Media Library & Resource Center (library.scconline.org)