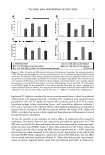
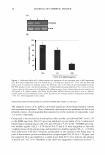
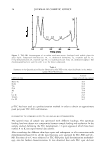
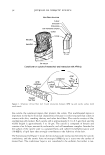
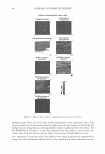
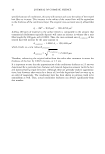
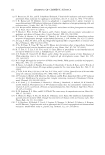
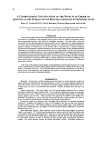
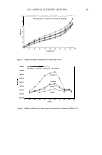
2005 ANNUAL SCIENTIFIC MEETING Ld = L-Lw (2) where L, and Lw denote the total fiber length and the length of the inter-fiber water column (the length of the wetted section of the hair fiber), respectively. The above model has been even further developed. Equation (3) describes the behavior ofa hair array consisting of many fibers. Nmax, denotes the maximum number of fibers that that clumps clump together in a hair bundle under given conditions: Nmax = (16 L 4 d2 y/9K) 113 Some Results (3) Using equations 1, 2, 3 and some other more detailed equations, the values the average bundle sizes, the amount of water absorbed per bundle, the energies required for separating hair fibers and hair bwidles by combing, have been calculated as functions of the atmospheric humidity, hair fiber density, hair fiber cross- sectional areas and contact angles of water on hair surfaces. The results will be presented in detail. (For a typical result, see Figure 3). The implication of the results for the formulation of various hair products, will also be discussed. l.) Jose Bico, Benoit Roman, Loie Moulin and Arezki Boudaoad, Nature, 432,690, (2004). Figure 1 Schematic Representation of the Model Hair fibers Figure 2 Schematic Repreaentatlon of Fibers (Longitudinal Sections) flll Lilf Number of Fibers /Strand lnter-flNr dl•t■nae (m•ter) Figure 3 85

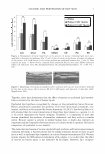
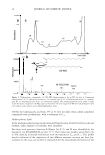
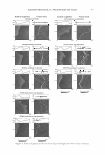
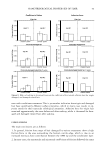
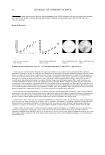
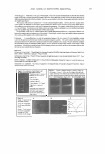
86 JOURNAL OF COSMETIC SCIENCE METHOD DEVELOPMENT: EVALUATION OF PERIORBITAL WRINKLES USING A 3-D MICROTOPOGRAPHY IMAGING SYSTEM Amy Zimmerman, Sarah Whitehead and Brittany Malover Access Business Group, Ada, MI Introduction The ability to objectively and accwately evaluate topographical information from human skin is a valuable tool in skin care and cosrretic science research. To date, the nDst collllIDn and accepted m:thod of topographical analysisis the use of an optical or tactile scanning device to m:asure the surface profile of silicon skin replicas. Although useful, the replica techni que has several limitatio including contact with the skin, long acquisition tim:, variable silicon flow properties, and difficulty reproducing replica placem:nt between visits. These limitations make the desire to perform 3D topographical m:asurerrents on in viw human skin very intriguing. Stripe or fringe pattern projection techniques have been used for several years to m:asure technical surfaces such as coJI1llller chips. In this technique, parallel stripes with sinusoidal intensity of brightnessareprojectedontoasurfaceandbecom: distorted in shape and grey-value intensity due to the topography of the surface. These distortions are recorded at a defined triangulation angle by a CCD camera and transferred to a COJl1)uter for quantitative evaluation using phase shift algori [1,2]. Stripe projections have not been suitable to m:asure living tissue, due to the dynamic projection and acquisition tim: neeoo:I to overcom: error produced from involuntary skin nDvem:nts. With the help of high-velocity, pixel-wise controllable digital micro mirror projection technology, an optical 3D microtopography imaging system was developed in an �t to overcom: this issue [1, 2]. A study comparing replica and microtopography imaging measw-errents show the in vivo device to be ODre reproducible in regards to surface roughnes.5 calculatio [3]. The objective of our study was to evaluate this 30 microtopography imaging system through the designandoptimizationofam:thodforperiorbitalwrinkleanalysis. Method: The skin's topographicalprofilewasgeneratedandevaluatedusing a 13xl8mm2fieldoptical scanning system (PRIMOS 3-D: Phase-shift Rapid In-Vivo Measurerrent of Skin, GFMesstechnick GmbH and CanfieldScientific). The study focused on 4 issues: 1 )image capturerepnxlucibility 2)protocol desi gn for 3 wrinkle ireasurem:nt panureters (wrinkle depth, wrinkle volum:, and surface roughness) 3 )sensitivity level of the image capture and rreasureirent techniques and 4 )ability to detect a treatrrent cream from a placebo. To address image capture reproducibility various subject, operator, machine, and envirorurental "factors" were varied to discoverthecombinationthatprovidedthesmallestdeviationanDngan"interrupted"and"uninterrupted"photoseries. The ''uninterrupted'' series consisted of 5 consecutive images beings captured without intentional subject ODvem:nt in between The "interrupted" series co isted of 5 images being captured with the subject repositioning himself in the device between each image and refocusing of the cam:ra by the system operator if necessary. FactoIS analyz.ed included posture, camera height, eyes open or closed, arm position, subject familiarity with machine and alignrrent instructions, type of headrest, camera angle, room lighting, and projector lighting intensity/aperture settings. Five subjects were used Using the software provided, protocols were designedtomeasw-e3wrinkleparam:ters. The sensitivity level or error values associated with each analysisprotocolweredeterminedon36photo sets obtained from 18 individuals. Each individual had 6 uninterrupted images captured on 2 separate visits. In addition, wrinkle depth and volum:m:asurementsweretakenat2places along the wrinkle, increasing the anDllllt of data sets used to calculate their associated sensitivity level to 72 sets. The sensitivity level was calculated as the average of all the data set standard deviations. To evaluate the system's ability to detect a treatrrent cream from a placebo, a small-scale 4 week single-blind clinical study was perform:d. Images were captured each week and the 3 developed analysisprotocolsperforrred. Results and Discmsion: By selecting the appr�riate image capture settings for each of the fuctors investigated -for example, standing upright as opposed to sitting -thestandarddeviationanDng interruptedanduninterruptedphoto sets was decreased by 98.2%. Figure 1 outlines our optimal image capture settings. By decreasing this deviation, we have increased our ability to quickly capture acceptable images during follow-up visits. In addition, the software has a built in "elastic matching" function that can take these similar images and reposition the follow-up images to within about 2 microm:ters of the baseline image in the x, y, and z planes [4]. This function does oot change any of the topographical data, but shifts it in the proper manner needed to reveal areas where compariso cannot be made due to the data being collected on slightly different areas of the skin (Figure 2). Using our collected images, 3 wrinkle analysis protocols were developed: !)wrinkle depth 2)wrinkle volume and J)surfuce roughness. Each analysis technique starts with the sanr image "p-eparation" procedure. This includes elastic matching of follow-up images to baseline images, cropping images to rermve invalid data sections revealed by elastic matching, rermving hairs, and filtering to separate the microstructure from the macrostructure features of the face (Figure 2) [1]. The order in which these steps are perform:d proved to be critical and som:what restricted due to the software. The rermining "details" of the 3 analysis techniques were based on recommendations from the vendor, accuracy of the procedure, aoo'or tim: efficiency. For example, when m:asuring wrinkle depth or wrinkle volume one must consider what sectio of the wrinkle to m:asure, how many cross sectiO!l'i to m:asure, what co titutes a valid cross section length, and what lll.lITlbeIS to record for the calculations. For our study it was decided that 2 cross-sections would be used -oneatthedeepestandoneattheshallowestportionofthe
Purchased for the exclusive use of nofirst nolast (unknown)
From: SCC Media Library & Resource Center (library.scconline.org)