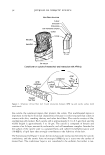
26 JOURNAL OF COSMETIC SCIENCE EXTRACT ANALYSIS BYTLC/FID Qualitative analyses of the lipid classes present in an amber wool-wax extract and the different lipid fractions (A to K) obtained by p-TLC were performed by a TLC-FID system (Iatroscan MK-5 Iatron Laboratories, Inc., Tokyo, Japan). The standard com- pounds or the dry extract of amber wool wax (25-60 mg) were redissolved in chloroform/ methanol (2/1, v/v) (5-12 mg ml- 1 ). Sample aliquots (0.8 µl) were spotted onto silica gel-coated Chromarods (type S-111) (Iatron Laboratories, Inc.) by means of a 2-µl preci- sion Hamilton syringe (Bondaluz, Switzerland) coupled to a semiautomatic sample spotter SES 3200/IS-0l (Nieder-Olm GmbH, Germany). The rods (in sets of ten mounted semipermanently on stainless-steel racks) were developed using different mo- bile phases in order to identify them as a function of the lipid classes. For non-polar lipid classes, the rods were sequentially developed four times according to the method de- scribed elsewhere (1). For polar lipid classes, the rods were developed initially with (i) 70 ml of n-hexane/ diethyl ether/ formic acid (5 3/17 /0.3, v/v/v) up to 10 cm (to separate the non-polar lipids). After a partial scan of 80% to eliminate the non-polar lipids, the redevelopment of the rod with (ii) 70 ml of chloroform/n-hexane/acetone/methanol (5 5/5/7 /3, v/v/v/v) up to 10 cm and (iii) 70 ml of chloroform/n-hexane/acetone/methanol (48/12/9/1, v/v/v/v) up to 10 cm, leads the separation and identification of the polar lipids. After each development, the rods were heated for 5-10 min at 60°C to dry the remaining solvent, and run through a FID in the Iatroscan, by using an air flow of 2 l min- 1 , a hydrogen flow of 160 ml min- 1 (high-purity hydrogen, C50), and a scanning speed of 3.0 cm sec- 1 . A total scan was performed to identify all the lipid components. Data were then processed with the Boreal software version 2.5 fromJMBS Developments (Grenoble, France). Quantification of the polar lipid classes present in the amber wool- wax fraction was carried out according to their response factor (22). For the non-polar lipids, response factors were: mono-ES= 32.007, di-ES= 21.322, TG= 27.652, FFA= 24.529, AL= 26.748, and S= 43.046. GC-MS CHARACTERIZATION Sample preparation Each fraction extract (100 µl) isolated by p-TLC (section 2.2) was transferred to a 2-ml conic vial and evaporated to dryness under a gentle nitrogen stream. Fractions were silylated using BSTFA as reported elsewhere (18). Silylation was performed to decrease the polarity of a wide range of lipidic compounds in order to improve the chromato- graphic peak shape and to increase the compound's volatility. Instrumental analysis An Rtx 5-MS of 15 m with an internal diameter of 0.25 mm and a film thickness of 0.25 µm of 5 %-phenyl-methylpolysiloxane was purchased from Restek (Bellefonte, PA). One microliter of sample was injected in the splitless mode at 300°C. The initial temperature was held at 70°C for 1 min, and then programmed at 10° min- 1 to 350 ° C, with the final temperature kept for 15 min (44 min total analysis time). Chromatographic analysis was performed in the constant flow mode at 1.2 ml min - 1 . A GC 6890A from Agilent Technologies (Palo Alto, CA) coupled to an MS detector 5973N was used for either the electron impact or chemical ionization modes. The

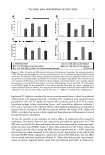
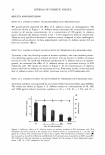
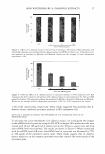
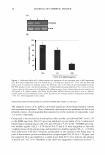
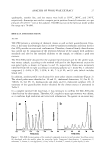
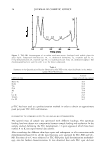
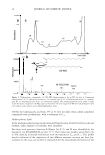
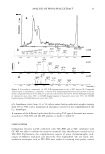
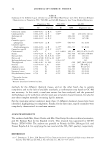
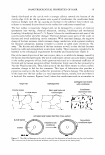
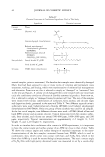
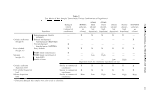
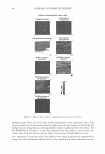
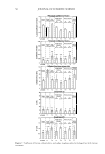
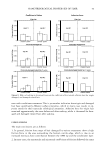
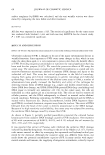
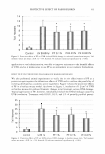
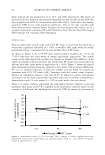
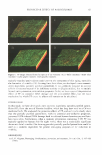
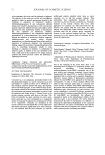
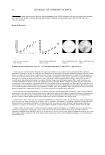
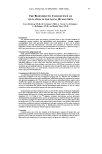
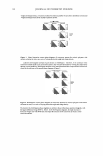
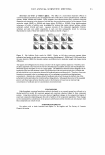
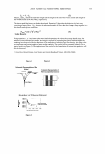
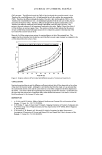
ANALYSIS OF WOOL-WAX EXTRACT 27 quadrupole, transfer line, and ion source were held at l 50°C, 280°C, and 230°C, respectively. Ammonia was used as a reagent gas in positive chemical ionization, at a gas pressure of 14.8· 10- 5 torr at the analyzer. The MS was run in the full-scan mode within the range m/ z 7 0-800. RES UL TS AND DISCUSSION TLC-FID TLC-FID permits a screening of chemical classes as well as their quantification. How- ever, it has some disadvantages due to its low-to-moderate resolution and from the fact that FID provides no structural confirmation. Therefore, chemical family identification was carried out by comparison of the retention behavior of the sample with authentic standards and also by the standard addition to the sample, to confirm a peak area increase. The TLC/FID profile obtained for the standard lipid mixture and for the amber wool- wax extract sample, according to the method indicated in the Experimental section for non-polar lipids, is shown in Figures la and 1 b, respectively. Peaks were tentatively identified from left to right according to increasing polarity as 1: mono-ES 2: unknown compound 3: di-ES 4: TG 5: FFA 6: AL 7: S 8: PL and 9: salts (which includes S-Sul) (23). In addition, another profile was obtained for more polar elution conditions (Figure 2). The eluted peaks were identified as: 10 and 11, cholesterol derivatives 12, Cer II 13, 7OH-S 14, Cer VI 15, hydroxyacids and diols and 16, cholesterol sulphate (23). A summary of the quantification results obtained for the chosen extract is presented in Table I. In a complex mixture like wool wax, it was necessary to confirm the TLC-FID peak identification by other means. Therefore, GC coupled to mass spectrometry was chosen, as it combines high resolution and structural information. To operate in an easier way, a 3 0.0 0.1 6 0.2 0.3 Time (min) 7 0.4 0.5 2j fi "C C :::, b o.o 0.1 0.2 0.3 Time (min) 9 0.5 Figure 1. TLC-FID chromatograms of the standard compound mixture (a) and an amber wool-wax extract (b) developed with the mobile phase for non-polar lipids. Compound identification: 1, monoesters 2, unknown 3, diester 4, triacylglycerol 5, fatty acids 6, alcohols 7, sterols 8, polar lipids 9, salts.
Purchased for the exclusive use of nofirst nolast (unknown)
From: SCC Media Library & Resource Center (library.scconline.org)