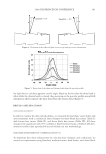
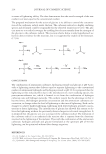
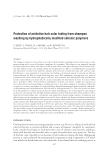
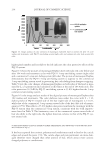
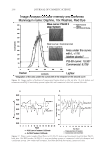
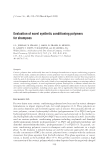
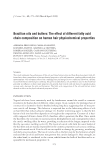
J. Cosmet. Sci., 60, 199–204 (March/April 2009) 199 Experiments in Raman spectroscopy of hair: Exciting light and molecular orientation PAUL CARPENTER and FRASER BELL, Unilever R&D–Port Sunlight, Quarry Road East, Bebington, Wirral, CH63 3JW, U.K. Synopsis Hair fi bers have been analyzed by Raman spectroscopy to assess the suitability of a range of excitation wave- lengths for data collection over extended periods of time. It is found that the optimum excitation wavelength for spectral detail, of these tested, was 780 nm and that this wavelength resulted in little signal degradation over time. It was found that with higher energy excitation sources that the signal intensity of the spectra degraded signifi cantly in short periods of time. This work suggests that near-IR Raman spectroscopy there- fore offers the most suitable conditions to analyze the nature of secondary structural feature in hair fi bers. In addition, a preliminary exploration of the structural orientation of spectral features of the hair was at- tempted. Through the use of a linearly polarized excitation source the intensity of the Raman spectral fea- tures were observed to change as the alignment of the fi ber axis with respect to the plane of polarization was changed. It was found that the spectral features associated with the α-helical vibrations decreased in intensity as the fi ber axis was rotated from an orientation parallel to the exciting beam. INTRODUCTION Sensorial properties of hair, specifi cally the tactile and visual attributes, are related pri- marily to the surface morphology and mechanical properties of single hair fi bers. Reliable quantifi cation of fi ber properties at various length scales is therefore critical in the predic- tion of sensorial behavior within the personal care industry. In particular, characterization of fi bers at the micron and sub-micron scale—correlating local mechanical properties with chemical composition—will lead to an improved understanding of the behavior of hair, and will assist in the design and development of hair care technologies. Raman spectroscopy is a technique commonly used to study vibrational, rotational and other frequency dependent structural motion within simple and complex molecular sys- tems. The technique is commonly used in protein chemistry as the vibrational informa- tion is specifi c for different chemical bonds and environments within molecules but also has applications for the exploration of protein fi lms, and as in the experiments detailed below, protein fi bers. A wide range of physical processes and chemical and treatments alter the tactile and visual characteristics of hair and these high order changes have been reported to be accompanied by changes in the frictional properties, chemical composition and mechanical response.

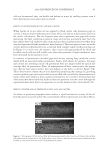
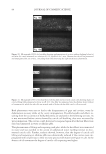
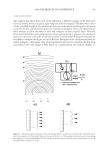
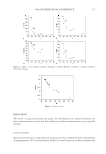
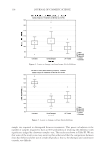
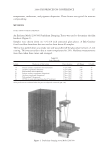
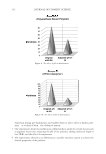
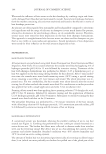
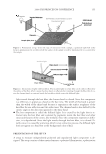
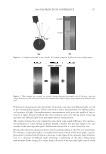
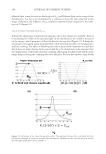
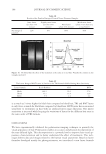
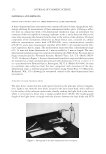
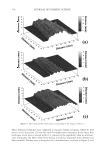
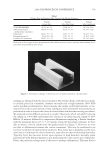
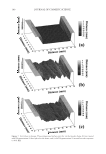
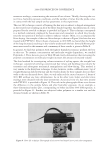
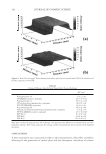
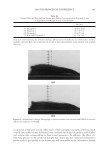
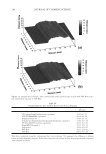
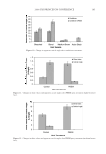
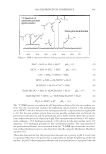
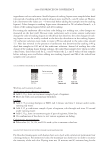
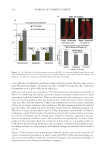
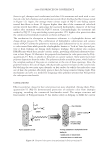
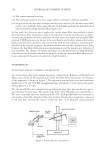
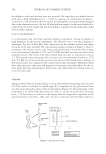
JOURNAL OF COSMETIC SCIENCE 200 Raman spectroscopy has been used previously to investigate changes to keratin fi bers after chemical and physical treatments (1–4) and this paper describes two outcomes from a series of preliminary experiments scoping the suitability of the technique to hair fi ber analysis. Consequently, Raman spectroscopy has been applied to obtain baseline measures with the intent of examining the structural phenomena associated with the chemical and physical changes further in a continuing series of experiments. The fi rst objective of this piece of the work was to optimize experimental parameters for spectra quality and collection times of Raman spectra. It is well known that Raman signal intensity of hair should in- crease signifi cantly with a shorter excitation wavelength (3) as Raman signal intensity is proportional to the fourth power of the inverse of the incident wavelength. However, the background luminescence would also be expected to increase signifi cantly with shorter excitation wavelengths (5). Secondly, an investigation has been carried out to determine whether methodologies that have been applied to determine molecular order in commercial polymers can be applied to hair fi bers. The Raman spectra, obtained using a polarized light source, of commercial polymers have been shown to exhibit sensitivity to orientation and this methodology has previously been used to estimate molecular orientation of polypropylene in spun fi bers (6). Similar methods have been applied here. EXPERIMENTAL Virgin yak hair samples were supplied to Avacta Analytical Ltd. (York, UK) for the col- lection of Raman spectra. As in previous work, yak hair has been used as a pigment-free representative model of human hair reducing the problems that are encountered from background fl uorescence. To determine the optimum collection protocol laser wavelengths of 780 nm, 633 nm (red) and 514 nm (green) were selected. A RenishwÒ System 1000 Raman Microspec- trometer was used. The detector slit was set at 15 μm and the binning box to 20 pixels wide. A quarter wave plate was used in the excitation path to make the light incident to the sample approximately circularly polarized to minimize variations in band intensities due to polarization/orientation effects. The fi ber was orientated at no specifi c alignment to the light source. The system was calibrated using a set of emission lines from a neon lamp and the system performance verifi ed using a standard silicon sample. The accuracy of the spectra is within approximately ±1 cm−1. The samples were secured onto a micro- scope slide, which was placed onto the Raman microscope and the surface focused using a 50×, 0.75NA microscope objective. To explore the fi ber orientation characteristics the Raman microspectrometer was set up as described above, though a quarter wave-plate was not used the light incident to the fi ber was therefore linearly polarized. The laser wavelength selected was 780 nm. The fi - ber longitudinal axis was orientated parallel to direction of polarization of the beam and the spectra recorded. The samples were then rotated 90° so that the longitudinal axis was perpendicular to the direction of polarization and further spectra recorded. Though mea- surements were made at different rotations it was ensured that measurements were made at the same position of the fi ber surface. Spectra were recorded using the synchronous scanning mode, covering the spectral range from 200–1700 cm−1 with an exposure time of 60 seconds.
Purchased for the exclusive use of nofirst nolast (unknown)
From: SCC Media Library & Resource Center (library.scconline.org)