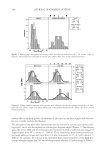
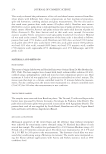
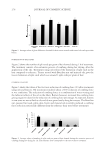
JOURNAL OF COSMETIC SCIENCE 182 CONCLUSIONS A laser stereometer was constructed in order to take measurements of hair fi ber assemblies allowing for the generation of surface plots and the subsequent calculation of volume Figure 9. Root-lift technique. Three-dimensional surface plots for hair treated with PVP K30 (a) before and (b) after exposure to 90% RH. Table II Volume Difference Data for Hair Treated with Various Polymers ΔV (cm3) Polyquaternium-55 1.07 ± 9.03 VP/DMAPA acrylates copolymer 42.57 ± 39.55 Polyquaternium-11 69.94 ± 22.90 VP/acrylates/lauryl methacrylate copolymer 16.93 ± 3.18 VCL/VP/DMAEMA copolymer 26.00 ± 6.02 Polyquaternium-69 46.93 ± 9.94 Isobutylene/ethylmaleimide/hydroxyethylmaleimide copolymer 3.93 ± 2.20 VP/VCL/DMAPA acrylates copolymer 25.57 ± 10.49 PVP K120 87.40 ± 5.09 PVP K90 92.81 ± 8.30 PVP K30 104.26 ± 16.9 Tests were conducted using the root-lift technique. ΔV represents the difference in volume before and after humi dity exposure. Each value represents the average of three measurements and is reported with standard deviation.
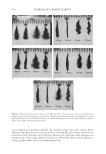
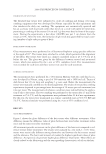
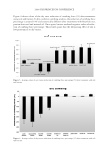
2008 TRI/PRINCETON CONFERENCE 183 occupied by a hair tress section. Three types of hair (straight, very curly, and frizzy) with visually noticeable volume differences were analyzed and found to produce surface plots and volume data corresponding to their visual appearance. In addition, the effect of a bleaching process on the volume of straight hair tresses was also examined and found to produce effects perceptible to the human eye and measurable by the instrument. Several Figure 10. Straight hair technique. Photograph of conventional hair tresses treated with PVP K30 (a) before and (b) after exposure to 90% RH. Table III Volume Difference Data for Hair Treated with Various Concentrations of Polyimide-1 and a High-Molecular-Weight Version of the Polymer ΔV (cm3) 1% Polyimide-1 79.08 ± 10.92 2% Polyimide-1 29.03 ± 7.44 4% Polyimide-1 10.80 ± 5.36 1% High MW Polyimide-1 50.14 ± 7.94 Tests were conducted using the root-lift technique. ΔV represents the difference in volume before and after humidity exposure. Each value represents the average of three measurements and is reported with standard deviation.
Purchased for the exclusive use of nofirst nolast (unknown)
From: SCC Media Library & Resource Center (library.scconline.org)


