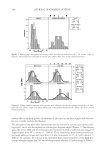
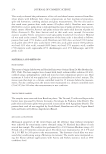
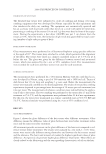
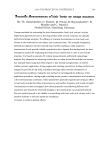
2008 TRI/PRINCETON CONFERENCE 255 POLYMER COMPOSITE PROPERTIES As stated earlier, the key to achieving composite properties is adhesion between the poly- mer and fi ber. Good adhesion allows stress transfer from the polymer to the fi bers, which prevents premature failure of the composite. Furthermore, if the polymer/fi ber interface (adhesion) is weak, it will dominate the fl exural properties (stiffness) of the composite (11). Consequently, the fl exure (three-point bend) test is an indirect measure of fi ber/ polymer adhesion (12). Considering the composite performance test results along with the polymer fi lm test (cohesion) results allows deductions to be made about the relative contributions of adhesion and cohesion to fi xative performance. Since hair has an overall negative charge at neutral pH, cationic substitution enhances the adhesion of cassia to hair through electrostatic bonding, which should facilitate the distinction between the contributions of adhesion and cohesion for this example. In the three-point bend test, stress is applied to the polymer composite to force failure. The mode(s) of failure depends on the relative strengths of adhesion (polymer to hair) and cohesion (polymer to polymer). If the adhesion to the hair is adequate relative to the ap- plied stress, the cohesive properties of the fi xative polymer will contribute to the compos- ite properties. Polymer cohesive properties determine how a polymer responds to applied stress and are infl uenced by molecular weight (entanglements), architecture (branching, tacticity, etc), crosslinking, crystallinity, attractive forces (hydrogen bonding, van der Waals forces, etc) and plasticization. When stress is applied to a polymer, the way it is Figure 3. Tensile strength (MPa) and elongation to break (%) versus charge density for fi lms of cassia and cassia hydroxypropyltrimonium chloride polymers. The error bars represent ± one standard deviation. Figure 4. Elastic modulus (E ) versus temperature (°C) for fi lms of cassia and cassia hydroxypropyltrimoni- um chloride polymers.
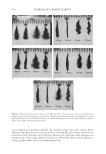
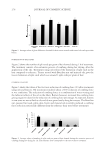
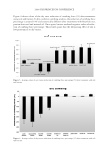
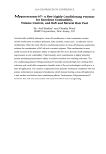
JOURNAL OF COSMETIC SCIENCE 256 dissipated depends on the cohesive properties of the polymer it may crack, yield, or craze at failure (13). For example, a stiff, brittle polymer may quickly crack to relieve an ap- plied stress, but plasticization may allow it to relax out the stress and prevent or delay breakage. Even with good adhesion, a polymer composite with poor polymer cohesion results in early failure and ultimately less stiffness. Composite stiffness test results repre- sent the balance of adhesive and cohesive forces under given test conditions. The average peak force stiffness (at 50% RH) for 0.5, 1.0 and 2.0% (w/w) solutions of the cassia HPTC polymers are shown in Figure 5. Overall, these data show a trend of increas- ing stiffness with increasing polymer concentration, which is known for fi xative poly- mers. The data also show a trend of higher stiffness for low cationic charge density (CD) polymer relative to the high CD polymer. The effects of concentration and cationic sub- stitution level for this example represent the contribution of polymer cohesive strength to composite stiffness. A higher concentration yields a thicker polymer fi lm, which is stiffer than a thinner fi lm of the same material, and for a given charge density, composite stiffness trends with the cohesive strengths observed in fi lm testing. The average stiffness data for 2% dispersions, tested at 50% and 90% RH, are shown graphically in Figure 6. Comparison of the stiffness value for cassia with the values for the cationic derivatives highlights the importance of adhesion to composite stiffness. Cassia gum was previously shown to have higher cohesive strength than the cassia HPTC polymers, Figure 5. Composite stiffness (peak force) versus concentration for cassia hydroxypropyltrimonium chloride polymers at 50% RH. The error bars represent ± one standard deviation. Figure 6. Composite stiffness (peak force) versus charge density at 2% concentration for cassia and cassia hydroxypropyltrimonium chloride polymers at 50% and 90% RH. The error bars represent ± one standard deviation.
Purchased for the exclusive use of nofirst nolast (unknown)
From: SCC Media Library & Resource Center (library.scconline.org)


