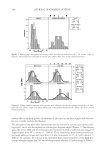
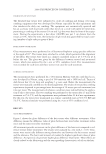
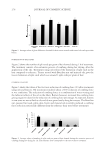
2008 TRI/PRINCETON CONFERENCE 163 O From the FWHM and position of the profi le, the selection function is calculated. O Selection function and profi les are multiplied to get Sin signal. These steps are summarized in Figure 11. CALCULATION OF Sout The selection function to isolate Sout is of the form 1-supergaussian. Many types of super- gaussian functions have been tested to obtain the best sensitivity. The simplest solution would have been to take all the light that was not considered to be part of Sin. However, we observed that this leads to relatively moderate increase sensitivity. This is caused by the intermediate part between the wings and the peak of the specular profi le which has a behaviour close to the one of the peak and dominates the Sout signal as it contains much more light that the far wings. After testing several cases, it was observed that the sensitiv- ity was increased when Sout was taken further from the specular peak. In this case, some of the specular light is considered neither in Sin nor in Sout. As Sout is observed only in the wings while the diffused light is observed for all the angles, the ratio of Sout and the Figure 11. Extraction of Sin from the specular profi le. The selection function is calculated (b) with the pa- rameters computed (a) from the specular light distribution. Multiplying the selection function and the spec- ular light profi le gives the Sin profi le (c).
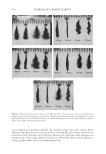
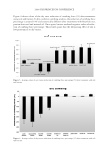
JOURNAL OF COSMETIC SCIENCE 164 diffused light is not the ratio on the height of Sout and Diffused light in the wings of the distributions. Sout has to be multiplied by a constant to keep the ratio observed in the wings. Otherwise, the infl uence of Sout would be underestimated compared to the infl u- ence of D (Figure 12). VISUAL WIDTH OF DISTRIBUTION (Wvisual) Among the advantages of polarization imaging, one is that images are available. Instead of measuring the width of the specular light on the distribution, the width is measured on the images, which permits to follow the band as the eye does (Figure 13). It keeps the advantage of averaging along multiple fi bers while limiting the effect of misalignment and bad combing. The effect of following the band is particularly important for dark hair which does not show chroma. In the case of dark hair, the shine band can be narrower than the displacement of the band caused by combing. Measuring the shine band width on the image helps reducing the combing effect for dark hair. For hair that shows a large width Figure 12. Extraction of Sout from the specular profi le. The selection function (b) is calculated with the parameters computed (a) from the specular light distribution. Multiplying the selection function and the specular light profi le gives the Sout profi le (c).
Purchased for the exclusive use of nofirst nolast (unknown)
From: SCC Media Library & Resource Center (library.scconline.org)


