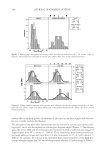
2008 TRI/PRINCETON CONFERENCE 189 D Sout L BNT Sin Wvisual = + 100* 1 * Sin = Integral inside the specular peak in the specular profi le Sout = Integral in the wings of the peak in the specular profi le D = Integral in the diffused profi le Wvisual = Mean value of the band width along the region of interest (ROI) from the real image Figure 1 explains how to decompose a specular spectrum into Sin and Sout by using selec- tion functions. The selection function to isolate Sin in the specular light is a Super Gauss- ian function, which is defi ned by its width and its position. The FWHM (full width at half maximum) of the selection function is twice the FWHM of the measured specular profi le. The position of the selection function is centered on the same point as the specu- lar light distribution. Then the selection function and measured profi le are multiplied together to give the Sin signal. The selection function to isolate Sout is of the form K*(1- Super Gaussian function), where K is a constant to keep the ratio observed in the wings. Otherwise, the infl uence of Sout would be underestimated compared to the infl uence of integral in the diffused profi le. The super Gaussian function used in Sout depends on the position only, and FWHM is fi xed and was optimized experimentally. Hair luster was measured with SAMBA in a dark box before and after treatment. Since the measurement results rely on a good positioning and combing of the hair tresses, we aligned the hair tresses uniformly in the same direction with a comb to ensure reliable results. To prevent fl yaway of hair fi bers on the sample holder due to static build up, we always wear cotton gloves when handling and combing the hair. The hair cleaning and treatment processes were strictly followed to apply shampoo or conditioner to the sample. Regarding the hair spray product, each hair tress was treated with 50 μl of product per gram of hair. The tress was permitted to air dry for 4 hours at room temperature. All luster data represents an average of the results obtained on 3 hair tresses, and each tress was measured twice. In each measurement, we determined 4 hair shine values: both sides at two orientations (root-to-tip and tip-to-root). Therefore, each luster value represented an average of 24 measurements. Figure 1. Decomposition of specular distribution.
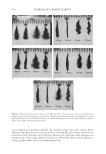
JOURNAL OF COSMETIC SCIENCE 190 APPARENT CUTICLE ANGLE MEASUREMENTS The apparent cuticle angle can be deduced from the angle difference between the maxi- mums of the specular profi les in tip-to-root and root-to-tip positions. To avoid the depen- dency on the origin and lower measurement uncertainty, instead of rotating hair samples, the sample holder is rotated to change the orientation from root-to-tip to tip-to-root. Figure 2 shows the two parallel polarization images taken with the same exposure time for two orientations of the hair. The distributions of specular light in tip-to-root and root-to-tip positions are plotted in Figure 3. For the perfectly aligned hair, the angle deviations of the refl ected light in root-to-tip and tip-to-root positions are 2α and –2α, where α is the apparent cuticle angle which is explained in Figure 4. So the angle differ- ence (β) between the maximum angles at the root-to-tip and tip-to-root orientations in the specular profi les is equal to four times of the apparent cuticle angle value. Therefore, we can deduce the apparent cuticle angle from the specular light distribution. For the light hair, of which the specular band contains both shine and chroma profi les, we found in the experiments that the data reproducibility is generally better to use the shine band only for Figure 2. Effect of hair sample orientation on shine images. Figure 3. Distribution of specular light at tip-to-root and root-to-tip orientations.
Purchased for the exclusive use of nofirst nolast (unknown)
From: SCC Media Library & Resource Center (library.scconline.org)


