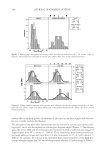
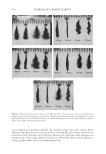
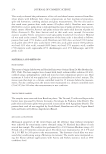
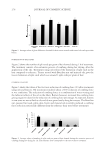
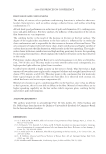
2008 TRI/PRINCETON CONFERENCE 229 FTIR IMAGE ANALYSIS OF DYED HAIR WITH AND WITHOUR TREATMENT FTIR spectroscopic image technique was used to study the dye content and distribution inside the dyed hair fi bers before and after anti-fading treatment. Array of spatially re- solved complete infrared spectra were collected from hair samples. From the spectra, each individual peak representing components of interest such as protein or dye molecules can be imaged. Then, spatial resolution distribution of components can be obtained. Figure 10 shows the FTIR spectrum of hair dye alone and the spectrum of bleached hair fi ber before dying. The dye molecule has an absorbance centered at 1106 cm–1. This band is used to evaluate the dye content and distribution within the hair fi bers. Figure 11 shows the FTIR spectra and images of dyed hair fi bers with the treatment and washes of PQ-55 Table III Polyquaternium-55 2-in-1 Anti-Fading Shampoo Ingredients %w/w Supplier Water 55.73 Polyquaternium-55 (20% active) 2.50 ISP Disodium cocoamphodiacetate (Miranol C2M NP) 15.00 Rhodia Cocamidopropyl betaine (Miratain CB) 3.52 Rhodia Ammonium lauryl sulfate (Standapol A) 6.00 Henkel Sodium lauroyl sarcosinate (Maprosyl 30) 12.0 Stepan C12-C15 Alkyl lactate (Ceraphyl 41) 0.50 ISP Glycol stearate (Cerasynt IP) 0.25 ISP Propylene glycol (and) diazoklidinyl urea (and) iodopropynyl butylcarbamate (Liquid Germall® Plus) 0.30 ISP Sodium chloride (25% solution) 2.00 Citric acid (25% solution) 2.20 Figure 8. Color loss of dyed bleached hair samples treated with (a) 0.5% PQ-55 2-in-1 shampoo vs 12% SLES and (b) 0.4% PQ-55 conditioner, 12% SLES washes, intense red color dye.
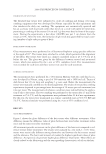
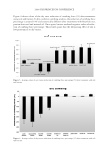
JOURNAL OF COSMETIC SCIENCE 230 anti-fading system (leave-in gel treatment, shampoo washing and conditioning) versus no treatment and SLES washes. In Figure 11a, the dye peak signal at 1106 cm–1 from the hair fi bers treated with PQ-55 system is much stronger than the untreated fi bers, indi- cating that there are more dye molecules retained in the treated hair fi bers than in the untreated fi bers. This result demonstrates dye molecule retention improvement within the hair fi ber of Polyquaternium-55 treated hair. The IR images of hair fi bers are created based on the area under the dye band at 1106 cm–1. Therefore, the IR image shows the distribution of dye molecules in the fi bers. The color of the images indicates the dye in- tensity with red color having the highest intensity and the dark blue color having the lowest intensity. The images of hair fi bers in Figure 11b suggest that the dye molecules are concentrated more towards the hair fi ber surface than to the center of the hair. The Figure 9. Pictures and color loss of dyed bleached hair samples treated with 2% PQ-55 leave-in gel and 0.5% 2-in-1 shampoo vs 12% SLES, intense red color dye. Figure 10. FTIR spectra of dyed and bleached dark brown hair fi ber before dyeing.
Purchased for the exclusive use of nofirst nolast (unknown)
From: SCC Media Library & Resource Center (library.scconline.org)


