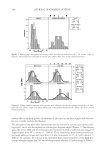
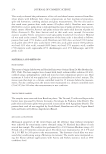
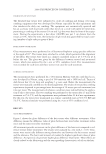
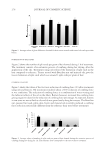
JOURNAL OF COSMETIC SCIENCE 202 The data contained in Figure 4 show that there is a clear decrease in the overall signal level in this spectral region as a function of time for all the excitation wavelengths. How- ever, this decay is especially apparent for the red and green excitation wavelengths, which exhibit decay times (time for the intensity to fall by a factor of 10) of the order of minutes compared with hours for the 780-nm excitation. The increase in luminescence background observed when higher energy lasers are used in Raman excitation is mainly due to the natural fl uorescence of the hair. The majority of signal decrease over time at shorter wavelengths is likely due to photobleaching effects and photon adsorption leading to localized heating of the sample at the area where the bean is incident, leading to thermal sample degradation. It is important to note that the decay curves are non-linear, oven on this log-linear plot. This supports the conclusion that the signal decay occurs due to multiple processes. Figure 3. Spectra collected at different time points with 514-nm excitation. Spectral intensity decreases with increasing exposure time. Figure 4. Plot of decay in Raman signal intensity (at 1550 cm−1) at different excitation wavelengths.
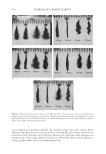
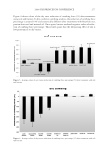
2008 TRI/PRINCETON CONFERENCE 203 Figure 5. Comparison of spectra from sample parallel and perpendicular to plane of polarization. Middle spectrum: long axis of fi ber parallel to plane of polarized laser. Bottom spectrum: long axis perpendicular to polarization. Top spectrum: Difference spectrum (parallel – perpendicular). In summary, this work demonstrates that 780 nm is the most appropriate excitation wavelength to use to investigate hair samples by Raman spectroscopy. The spectra collected when the fi ber is oriented parallel and when oriented perpendicular to the direction of polarization of the excitation laser are shown in Figure 5: the difference spectrum of the two is also shown. The Raman spectra recorded are observed to be sensi- tive to the orientation of the hair sample with respect to the laser polarization. The difference spectra features two a-helical at 1655 cm−1 (Amide I) and 935 cm−1 (C-C stretch), together with the Cα-H bending mode at 1314 cm−1 as being the most orienta- tion sensitive bands. As the anisotropic component of the fi ber is comprised mainly of α-helical intermediate fi laments, these results suggest that the relative intensities at 1655 cm−1 and 935 cm−1 could be used as a measure of alignment of the α-helical intermediate fi laments with the fi ber axis. This could be exploited to explore structural differences between hair samples of different ethnicity or hair subjected to different treatments. CONCLUSION The multiple wavelength experiments show that the 780-nm excitation is the most ap- propriate wavelength out of the set of visible-to-NIR wavelengths explored. It has been
Purchased for the exclusive use of nofirst nolast (unknown)
From: SCC Media Library & Resource Center (library.scconline.org)


