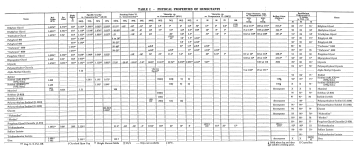
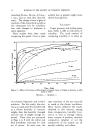
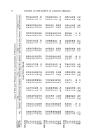
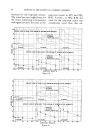
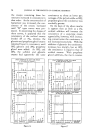
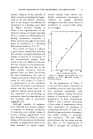
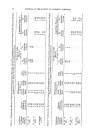
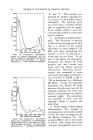
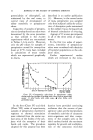
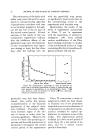
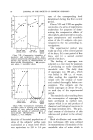
TESTING DEODORANTS WITH CHLOROPHYLL AND DERIVATIVES 35 purposes of maintenance of anaero- bic environments whereas hydrogen was used for this purpose in the experiments of Table 2. In both series, either nitrogen or hydrogen was bubbled, under pressure, through all samples of perspiration until specimens of vapor phases in the storage bottles showed concen- trations of oxygen less than 0.1 per cent as determined by the method of Carpenter and his collaborators (13). In both series of experiments, pooled samples of freshly collected perspiration were divided into three major portions which were buffered at three different levels of acid-base balances, viz. (1) slightly acid, i.e., pH = 4.00, (2) approximate neu- trality, i.e., pH = 7.00, and (3) slightly alkaline, i.e., pH = 8.00. Each of these three major portions was subdivided into three aliquots. Two aliquots were introduced into gas-washing bottles in contact with air. One of these was maintained in a refrigerator at 8 ø C. for forty- eight hours whereas the other was incubated at 37øC. during the same period. Immediately after intro- duction of the third aliquot into a gas-washing bottle, the air over the sample was displaced by either nitrogen (Table 1) or hydrogen (Table 2). These aliquots in con- tact with either nitrogen or hy- drogen were stored in incubators at 37øC. for periods' of forty-eight hours. In all experiments included in the two tables, the volume of the gas was 11 times the volume of the sample of perspiration in the gas- washing bottle. At the ends of periods of refrigera- tion or incubation pO values for odor were determined, measure- ments of pH were made and pour plates were prepared for differential counts of colonies of aerobic and anaerobic microiSrganisms (14). These two series of experiments were considered to be particularly instructive because they are repre- sentative of several attempts which have been made within the last two or three years to supplement purely organoleptic tests with quan- titative chemical procedures for sources of the odors. In addition to evaluations of odors in terms of pO units, all samples were analyzed for total volatile base and total volatile acids at the end of the period of incubation. For purposes of deter- minations of total volatile base, 100 c.c. of a stored sample were acidified with sulfuric acid to pH = 2.00 and then concentrated to 10 c.c. Sodium hydroxide was added to the concentrated sample in amounts sufficient to raise its pH to a level = 12.00. Then, the sample was distilled with steam and the dis- tillate was trapped in a known volume of 0.01 N acid. Excess acid was determined by electro- metric titration to neutrality. For determinations of total vola- tile acids, this procedure was modi- fied as follows. Before concentrat- ing the original 100-c.c. sample to one-tenth of its volume, it was alkalinized to pH = 12.00 by the addition of sodium hydroxide. Secondly, before the steam distilla-

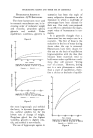
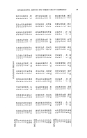
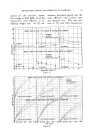
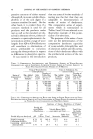
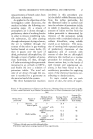
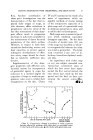
36 JOURNAL OF THE SOCIETY OF COSMETIC CHEMISTS tion, the concentrated sample was acidified with sulfuric acid to pH = 2.00 and the distillate was trapped in 0.01 N sodium hy- droxide. For purposes of estimating the probable errors in analyses for both volatile bases and volatile acids by the procedure outlined above, am- monium salts of caproic, caprylic, and burytic acid were utilized in recovery experiments. Analyses were carried out on either aqueous solutions of the individual salts or of mixtures of the three salts. Also, analyses were made of samples of perspiration to which varying amounts of the salts had been added. Inasmuch as no significant differ- ences were observed among results of tests of the aqueous solutions, on the one hand, and, on the other, the recoveries from samples of perspiration, the findings of both of these series of analyses have been combined in the following sum- mary. Also, no distinction has been made between the findings for pure solutions of individual salts and those for solutions of mixtures of the three salts. In a total of 13 experiments, the mean of recoveries of volatile acids was 102 4- 3.3 per cent of the theoretical. Themean of recoveries of volatile base as ammonia was 92 4- 3.5 per cent of the theoretical. In each of the two series of experi- ments, the refrigerated aliquots of pooled samples of perspiration were utilized as the basic standards for evaluation of the data for the in- cubated aliquots of approximately equivalent levels of acid-base bal- ances. Values for pH reported in the tables are those determined at the ends of periods of either re- frigeration or incubation. In gen- eral, the•se results do not differ significantly from the initial levels of pH at which the aliquots had been buffered. It will be of interest to note that, during periods of incubation under both aerobic and anaerobic condi- tions, rates of reproduction of micro- organisms in the pooled sample of perspiration used in the second series of experiments were enor- mously greater than were the com- parable rates determined for the composite sample of perspiration utilized in the first series (Table 1). Also, the increments in pO values of aliquots of the former sample which had been buffered at pH levels of 7.00 or above prior to storage in contact with air exceeded the in- creases in intensities of odors of the latter sample under similar test conditions. The probable explana- tion for these two differences be- tween the pooled samples of per- TABULATION A--COMPARATIVE CONCEN- TRATIONS OF NITROGENOUS COMPOUNDS IN POOLED SAMPLES OF PERSPIRATION BEFORE INCUBATION Constituent Concentration as Mg. per 100 c.c. In Sample In Sample of Table of Table 1 2 Total N 71.4 98.9 Non-protein N 59.1 78.6 Urea N 40.5 54.4 Ammonia N 4.2 5.6 Amino N 0.6 4.0
Purchased for the exclusive use of nofirst nolast (unknown)
From: SCC Media Library & Resource Center (library.scconline.org)