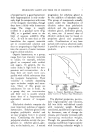
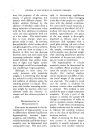
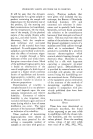
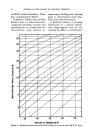
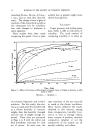
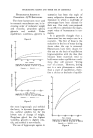
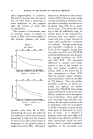
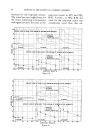
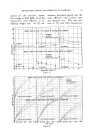
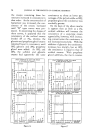
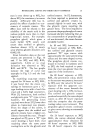
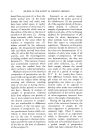
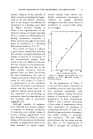
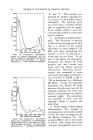
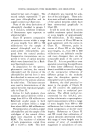
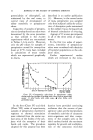
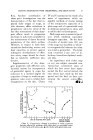
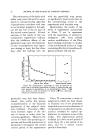
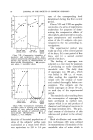
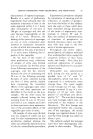
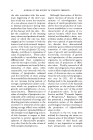
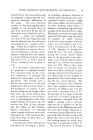
TESTING DEODORANTS WITH CHLOROPHYLL AND DERIVATIVES 41 tained 6.2 per cent of copper. The second sample represented 77 per cent pure chlorophyllins and its copper content was 5.0 per cent. None of the three derivatives of chlorophyll, classified in groups 2 to 4 inclusive, exhibited evidences of fluorescence upon exposure to ultraviolet light. Chart II presents comparative transmission curves within a range of wave lengths from 400 to 700 millimicrons for the sample of natural chlorophyll and for the water-soluble chlorophyllins pre- pared from the natural product. Comparative transmissions are re- ported in terms of optical densities which were determined by a Beck- man Spectrophotometer. In preparation for the spectro- photometric analyses, the natural chlorophyll and the mixture of the chlorophyllins derived from it were first dissolved in acetone and, then, extracted from the acetone solutions by ethyl ether. The latter extracts were used in determinations of the optical densities reproduced graphi- cally in Chart II. Curves for both products show maximum optical densities within a range from 410 to 430 millimicrons. Relatively smaller peaks in both curves are evident within a range from about 640 to 660 millimicrons. The preparation of sodium-copper chlorophyllins and the sample of the acid-digest of the natural chloro- phyll were dissolved in 0.01 N KOH. The reactions of solutions of both preparations varied from pH = 11.50 to 12.00. This level of alkalinity was required for solu- tion of the acid-digest. These solu- tions were utilized in determinations of the optical densities which have been summarized graphically in Chart III. It will be noted that both curves exhibit maximum optical densities at wave lengths of approximately 420 millimicrons. In this respect, the two curves of Chart III are in good agreement with the curves in Chart II. However, peaks in curves of Chart III at the higher wave lengths, i.e., from 640 to 660 millimicrons are definitely smaller and more divergent than are the comparable peaks of the curves of Chart II. It is not possible to even speculate concerning the significance of these latter differences because there is available no exact knowledge of the comparative influences of different groups in the molecule upon the absorption spectra of chlorophyll and its derivatives. However, the chief practical in- terest in the graphs of Charts II and III concerns the application of these data to analytical pro- cedures. The official method rec- ommended by the A.O.A.C. pre- scribes colorimetric or spectrophoto- metric measurements within a range of wave lengths from 600 to 660 millimicrons but it does not exclude check comparisons at shorter wave lengths. References to Charts II and III reveal that utilizations of optical densities determined within this range of wave lengths may be sources of error of considerable magnitude in calculations of com-

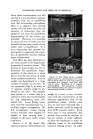
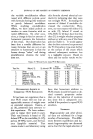
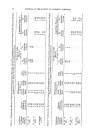
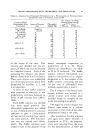
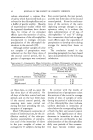
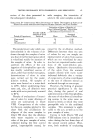
42 JOURNAL OF THE SOCIETY OF COSMETIC CHEMISTS parative amounts of either natural chlorophyll, its water-soluble chloro- phyllins or of the acid digest if a common standard be used. On the other hand, it is evident that, if a common standard is used for all products and the products under test as well as the standard are dis- solved in the same solvent, either col- orimetric or spectrophotometric de- terminations within a range of wave lengths from 420 to 430 millimicrons will contribute to eliminations of errors attributable to variations among the three products in respect to differences in absorption spectra. It was stated in the introduction that one asset of in-vitro methods of testing was the fact that they are adaptable to demonstrations of modes of action of deodorants. The comparative series of experi- ments which is summarized in Tables 3 and 3-A was selected as an illustrative example of this poten- tiality of in-vitro tests. The purposes of the series of tests were (a) the determination of the comparative deodorant capacities of water-soluble chlorophyllins and of aluminum sulfate and (b) correla- tions of their deodorant effects with the antibacterial actions of the two products. TABLE 3--COMPARATIVE ANTIBACTERIAL AND DEODORANT ACTIONS OF WATER-SoLuBLE CHLOROPHYLLINS AND OF ANHYDROUS ALUMINUM SULFATE ADDED IN VARYING AMOUNTS TO STALE PERSPI•TION DURING PERIODS OF 30 MINUTES Series of Comparative Tests Tests of Water-Soluble Tests of Anhydrous Alu- .Chlorophyllins .... minum Sulfate.-- Number of Number of Mg. Added Odor Viable Bac- Mg. Added Odor Viable Bac- to 100-c.c. Values teria as 10 a to 100-c.c. Values teria as 10 a Samples as pC per 1 c.c. Samples as pC per 1 c.c. 1 0 32 12,000.000 0 32 12,116.000 2 10 16 6,100.000 750 16 615.000 3 20 8 200.000 1,000 16 5.120 4 35 2 0.751 1,500 8 0.450 5 50 0 0.105 2,000 8 0.165 6 100 0 0.065 3,000 8 0.090 TABLE 3-A--CoMPARATIVE AMOUNTS OF BAsEs AND ACIDS IN STEAM DISTILLATES OF STALE PERSPIRATION AND OF SAMPLES OF THIS PERSPIRATION TO WHICH EITHER ALUMINUM SUEFATE OR WATER-SoLUBLE CHLOROPHYLLINS HAD BEEN ADDED Pooled Aliquots Analyzed Analyses of Steam Distillates of Pooled t-- -Aliquots Pooled Ali- quots Before Volatile Bases, Milli- Total Vola- •Distillation--- f . equivalents per Liter--• tile Acids, Milliequiva- pC Other than lents per pH Values Total Ammonia Ammonia Liter Negative controls 8.74 32 149.4 132.8 16.6 40.5 Containing A12(SO4)a 2.92 8 7.3 0.7 6.6 68.5 Containing water-soluble chlorophyllins 5.74 0 24.7 9.2 15.5 7.1
Purchased for the exclusive use of nofirst nolast (unknown)
From: SCC Media Library & Resource Center (library.scconline.org)