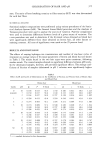
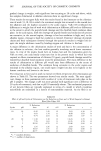
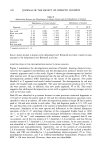
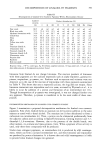
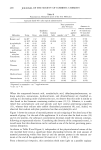
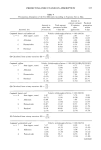
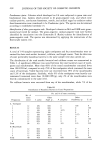
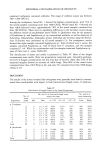
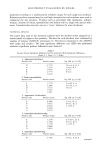
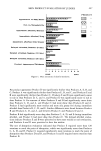
438 JOURNAL OF THE SOCIETY OF COSMETIC CHEMISTS Pseudomonas species. Colonies which developed on CA were subjected to gram stain and biochemical tests. Isolates which proved to be gram-negative rods, and which were oxidase-positive, non-lactose fermenters, motile, and utilized sugar by oxidation rather than fermentation were considered to be Pseudomonas species. The species was determined according to established methods (7). Identification of other gram-negative rods. Developed colonies on MA and EMB were gram- stained and tested for oxidase. The gram-negative, oxidase-negative rods were further identified by inoculation into the Enterotube I! (Roche) scheme for identification of gram-negative rods. The species was determined by applying the instructions of the Enterotube system (12). RESULTS A total of 144 samples representing eight toothpastes and four mouthwashes were ex- amined for their total aerobic bacterial, coliform, and fungal counts. Tests for detection of some potentially hazardous bacteria in the same sample were also carried out. The distribution of the total aerobic bacterial and coliform counts are summarized in Table I. A significant difference was noted between the total bacterial count of tooth- pastes and mouthwashes. More than 60% of the tested mouthwashes contained fewer than 100 CFU/ml, compared to only 25% of the toothpastes which contained the same count of bacteria/g. Viable bacteria were not recovered from 39% of the mouthwashes and 12% of the toothpastes. Similarly, while 6% of the toothpastes were heavily con- taminated (contained more than 10,000 CFU/g), only 2% of the mouthwashes were heavily contaminated to the same level. No coliform bacteria were recovered from any of the mouthwashes, while 7% of the Table III Distribution of Hazardous Bacteria in Tested Preparations No. and % of items containing items Other Other Preparation tested S. aureus Staph. sp., P. aeruginosa Pseudomonas sp. E. coli A. Toothpaste I 12 1(8) 0(0) 0 1(8) 0 2 12 0(0) 0(0) o o 1(8) 3 12 1(8) 1(8) 3(25) 0 0 4 12 0(0) 1(8) 0 0 0 5 12 1(8) 0(0) 0 2(17) 0 6 12 0(0) 1(8) 0 0 0 7 12 0(0) 1(8) 0 0 1(8) 8 12 0(0) 1(8) 0 0 0 Total 96 3(3) 5(5) 3(3) 3(3) 2(2) B. Mouthwash 1 12 0(0) 2(17) 0 0 0 2 12 0(0) 1(8) 0 0 0 3 12 0(0) 1(8) 0 0 0 4 12 0(0) 1(8) 0 0 0 Total 48 0(0) 5(11) 0(0) 0(0) 0(0)

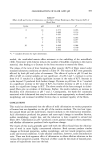
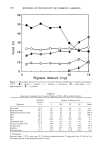
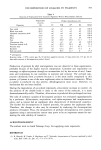
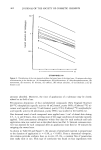
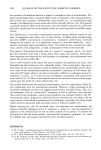
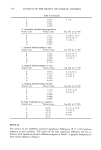
MICROBIAL CONTAMINATION OF PRODUCTS 439 examined toothpastes contained coliforms. The range of coliform counts was between 300- 1200 CFU/ml. Among the toothpastes, brand No. 1 showed the highest contamination, with 75% of the tested samples containing more than 1000 CFU/g. While brand No. 4 showed the least viable bacterial count, approximately 70% of the tested samples contained less than 100 CFU/ml. There were no significant differences in the bacterial counts among the different brands of mouthwashes tested (Table I). Qualitative tests for the presence of Pseudomonas sp. and Staphy/ococcus sp. by conventional methods, as well as detection of Escherichiae, Edwardde/lea, Sa/mone//ae, proteae, k/ebsielleae and Yersineae using the Entero- tube II (Roche) were performed on all tested samples (13). For toothpastes, results showed that eight samples contained Staphy/ococcus sp., three of which were S. aureus. Six samples contained Pseudomonas sp., half of which were P. aeruginosa, and two samples contained E. co/i. While for mouthwashes only five samples contained Staphy/ococcus sp., none of them were S. aureus (Table III). The distribution of yeasts and molds is presented in Table IV. Most of the fungal contaminants were molds. Only two preparations contained yeast. Generally speaking, the level of fungal contamination was less than that of bacteria. More than 50% of the examined samples showed no recovery of viable fungi. Over 80% of the tested items contained fewer than 100 CFU/g or ml, and only 5% contained more than 1000 fungal cells/g or mi. DISCUSSION The results of the survey revealed that toothpastes were generally more heavily contami- nated than mouthwashes with respect to both bacterial and fungal counts. In addition, Table IV Distribution of Fungal Counts in the Tested Preparations No. and % of items with fungal count No. and % of No. of within the range items containing items Preparation tested Min. Max. 0- 10 2 10 2-10 3 10 3-10 4 Yeast Molds A. Toothpaste 1 12 0 1.6 x 10³ 6(50) ' 4(33) 2(17) 0(0) 6(50) 2 12 0 3.2 x 10³ 10(81) 1(8) 1(8) 0(0) 5(42) 3 12 0 1.2 x 10² 10(81) 2(17) 0(0) 0(0) 5(42) 4 12 0 2.6 x 10³ 11(92) 0(0) 1(8) 0(0) 2(17) 5 12 0 2.0 x 10² 11(92) 1(8) 0(0) 0(0) 5(41) 6 12 0 1.2 X 10³ 9(75) 2(17) 1(8) 1(8) 3(25) 7 12 0 3.0 X 10³ 10(81) 0(0) 2(17) 1(8) 2(17) 8 12 1.0 X 10³ 8(57) 4(33) 0(0) 0(0) 4(33) Total 96 0 3.2 X 10³ 75(78) 14(15) 7(7) 0(0) 33(32) B. Mouthwash 1 12 0 4 x 10 12(100) 0(0) 0(0) 0(0) 1(8) 2 12 0 6 x 10² 11(92) 1(89) 0(0) 0(0) 1(8) 3 12 0 4 X 10² 11(92) 1(8) 0(0) 0(0) 2(17) 4 12 0 2 X 10² 11(92) 1(8) 0(0) 0(0) 1(8) Total 48 0 6 X 10² 45(94) 3(6) 0(0) 0(0) 5(11)
Purchased for the exclusive use of nofirst nolast (unknown)
From: SCC Media Library & Resource Center (library.scconline.org)