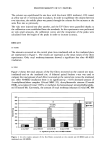
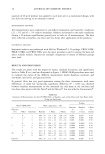
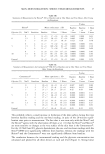
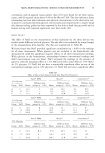
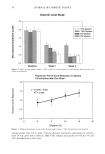
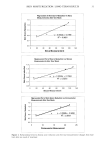
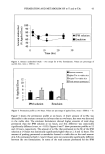
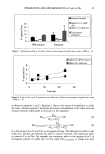
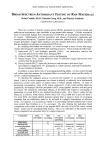
SKIN MOISTURIZATION: LONG-TERM RESULTS 29 Table III Summary of TEWL Changes from Baseline for One Hour, One Week, and Two Weeks of Treatment i Hour (n = 10) 1 Week (n = 20) 2 Weeks (n = 20) Different Different Different from from from Group Glycerin (%) Mean ñ SD groups Mean _+ SD groups Mean ñ SD groups A 0 0.71 ñ 1.01 0.20 ñ 1.02 B -1.30 ñ 1.20 B 5 0.85 _+ 0.62 -- 1.70 ñ 2.21 A 0.35 -+ 2.40 C 10 1.00 ñ 0.87 -- 0.97 ñ 1.26 0.12 ñ 1.73 D 15 1.89 ñ 1.68 -- 1.18 ñ 1.56 0.03 +- 1.77 B,C,D CORRELATION BETWEEN TEWL AND NOVA, SKICON, AND CORNEOMETER READINGS One hour after treatment, there was a weak linear correlation between TEWL and electrical measurements for Nova © (R-squared value -- 0.60), Skicon © (R-squared value -- 0.77), and Corneometer © (R-squared value -- 0.54). The two measures of barrier properties were not correlated following long-term glycerin treatment. SKIN DRYNESS EVALUATION Visual grading of skin dryness was performed at baseline and after one and two weeks of treatment (Table IV, Figure 2). The decrease in skin dryness was significant after one week for all treatments, and some further reduction occurred after two weeks. At one week, there was a linear relationship between decrease in skin dryness and glycerin concentration (Figure 3). Our results are in agreement with those reported by Bissett and McBride (15), who also observed a positive correlation between skin dryness reduction and glycerin concentrations of 5%, 10%, and 20% on human dry leg skin. The skin scores continued to decrease between weeks 1 and 2, with the greatest changes for the 5% and 10% glycerin formulations (Table IV). At two weeks, however, the absolute changes in grades were similar for 5%, 10%, and 15% glycerin levels, indi- cating a faster rate of improvement for the higher glycerin formulas. Bisset eta/. (15) reported a plateau in skin dryness improvement at glycerol levels of 10% and 20% after two weeks of treatment in human dry leg subjects. It is important to note the subjects in our study had moderately dry skin, with starting dryness grades of 1.9-2.0. The Table IV Summary of Grade Changes in the Two-Week Test: Dryness Score Evaluation--Decrease From Baseline 1 Week 2 Weeks Different Different Group Glycerin (%) Mean ñ SD from groups Mean ñ SD from groups A 0 0.88 ñ 0.87 -- 0.90 _+ 0.74 C B 5 0.95 ñ 0.96 -- 1.48 _+ 0.83 -- C 10 1.28 _+ 0.83 -- 1.55 _+ 0.60 A D 15 1.40 _+ 0.84 -- 1.45 ñ 0.79 --

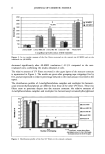
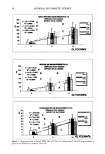
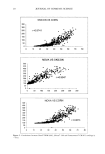
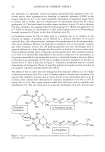
30 JOURNAL OF COSMETIC SCIENCE Glycerin Level Study •y777/-• 10% Glycerin T • 5% Glycerin • 0% Glycerin T T 2.5 2.0 1.5 1.o 0.5 o,o Baseline Week 1 Week 2 Figure 2. Skin dryness grades (mean +_ SE) vs glycerin concentration at baseline and after one and two weeks of treatment. Regression Plot of Score Reduction vs Glycerin Concentration after One Week 2.0 1.0 0.5 0.0 y = 0.0378x + 0.844 R 2 = . i i i i -5 0 5 10 15 20 Glycerin (%) Figure 3. Relationship between one-week dryness grades (mean _+ SE) and glycerin concentration. average grades were 0.5 at week 2 for the glycerin treatments, indicating the achieve- ment of very good skin condition. Half of the subjects had grades of 0 for the 5% and 10% formulations at this time.
Purchased for the exclusive use of nofirst nolast (unknown)
From: SCC Media Library & Resource Center (library.scconline.org)