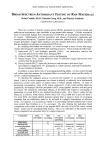
2000 ANNUAL SCIENTIFIC MEETING 79 INFLUENCE OF FORMULATIONS CONTAINING SALT AND GLYCERIN ON ELECTRICAL PROPERTIES OF SKIN: CORRELATION BETWEEN SINGLE TREATMENTS AND LONG -TERM RESULTS Randy Wickett, Ph.D., F. Li, E. Conroy and M. Visscher, Ph.D. University of Cincinnati College of Pharmacy and Children • Hospital Medical Center, Cincinnati, Ohio INTRODUCTION While electrical measurements on skin correlate to the extent of skin hydration in many circumstances(l~ 6) there is still some controversy about what they actually measure. For example, there is concern about the possible confounding effect of salts, either in the formulation or on the skin Salt may increase the conductance of the skin and may lead to changes in electrical properties that are not related to increased water content. We have performed a systematic study of the effects of salt and glycerin on the electrical properties of skin as measured by three •nstruments, the NOVA© DPM 9003, the Corneometer•) CM 825 and the Skicon© 200. The objectives of the study were two-fold. The influence of salt in the presence of glycerin was investigated in a single application study and the ability of a single application study to predict the results of a longer-term product application was tested. MATERIALS AND METHODS In the first single application a full 3 by 3 factorial design was employed using NaCI from 0 to 3% and glycerin from 0 to 10% in a simple vehicle as shown •n table 1. Table 1. Nine formulations from a full 3*3 factorial design by alternating NaCI and Glycerin levels for first single application study Formula No. Phase Ingredients* I 2 3 4 5 6 7 8 9 Mineral Oil 3.0 3.0 3.0 3.0 3.0 3.0 3.0 3.0 3.0 CSA** 1.0 1.0 1.0 1.0 1.0 1.0 1.0 1.0 1.0 Oil Brij©72 1.5 1.5 1.5 1.5 1.5 1.5 1.5 1.5 1.5 Brij©78 2.5 2.5 2.5 2.5 2.5 2.5 2.5 2.5 2.5 NaCI 0 1.5 3.0 0 1.5 3_0 0 1.5 3.0 Glycerin 0 0 0 5.0 5.0 5.0 15.0 15.0 15.0 Natrosol 0.5 0.5 0.5 0.5 0.5 0.5 0.5 0.5 0.5 Water Germaben II 0.1 0.1 0.1 0.1 0.1 0.1 0.1 0.1 0.1 Deionized Water 91.4 89.9 88.4 86.4 84.9 83.4 76.4 74.9 73.4 * W/VV% of ingredients in the formula ** Cetyl Stearyl Alcohol In the second single application study and the long-term test formulations contained 0, 5, 10 or 15% glycerin with 1.5% NaCI in the same vehicle. All test subjects were healthy females between the ages of 18 and 65 who signed informed consent. There were 23 subjects in the first single application study and 10 in the second. Twenty subject completed the long-term test. The following instruments were used to measure electrical properties, the Corneometer CM 825© (7)(Courage-Khazaka Electronic, Koln, Germany), the NOVA© Dermal Phase Meter 9003 (8)(NOVA Technology Corporation, Portsmouth, NH, USA) and the Skicon-200© (9)(lBS Company, Hamamatsu, Japan). In the single application studies instrumental measurements were made before product application (baseline) and again one hour after lotion treatment. In the long-term studies measurements were made before handing out the products and at one and two weeks at least 16 hours after the last treatment. Products were applied by the investigator in the single application study and twice daily by the panelists during the two week study. Application sites were on the outer aspect of the lower legs. All measurements

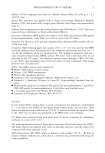
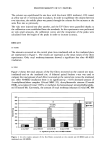
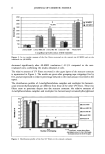
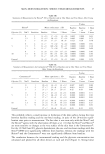
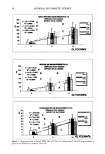
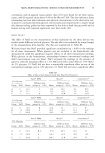
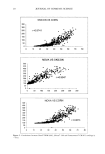
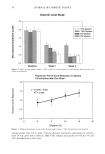
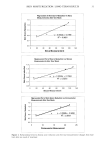
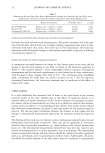
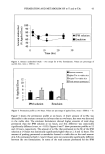
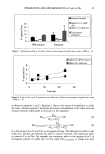
80 JOURNAL OF COSMETIC SCIENCE were conducted in a under controlled temperature and humility conditions (22+2 øC and 45+5% relative humidity) after the subjects had equilibrated to room conditions for at least 30 minutes. RESULTS Effects of NaCI and glycerin on electrical measurements after a single application are summarized in table 2. Interestingly NaCI reduced the measurements slightly for a three instruments in the absence of glycerin but increased the readings in the presence of glycerin. In general the maximum salt effects was seen at 1.5% NaCI and the effect was somewhat less at 3.0%. Table 2: Effect of salt at each glycerin level one-hour post-treatment 0% GLYCERIN NOVA DPM SKICON CORNEOMETER I [DIFFERNENT DIFFERENT FROM DIFFERENT FROM I FROM GROUPS GROUP NACL MEANS GROUPS (P0.05) MEANS GROUPS (P0 05) MEANS I(P0 05) A 0 31.0 C 23.9 B, C 8 4 B, C B 15 217 132 A,C 55 A,C I C i 3 113 A 25 A,B 16 A,B 5% GLYCERIN NOVA DPM I SKICON CORNEOMETER • MEANS [ I ] I DIFFERENT FROM ] DIFFERENT FROM I ]DIFFERENT FROM GROUP I NACL GROUPS (P0 05) MEANS [ GROUPS (P0 05) MEANS GROUPS (P0.05) A __ 0 99.1 B 61.8 B 17 7 B B 1 5 156.0 A 96.2 A, C 21 4 A, C C I 3 116 0 69.9 B 14.9 B 10% GLYCERIN ] NOVA DPM SKICON I CORNEOMETER ] , ] I DIFFERENT FROM DIFFERENT FROM DIFFERENT FROM GROUP ] NACL MEANS GROUPS (P0 05) MEANS I GROUPS (P0 05) MEANS GROUPS (P0.05) I•C 0 131 2 B, C 97 8 B, C 22.4 B 1 •-- - 239.0 A 136.4 A, C 29 9 A, C 3 213.0 A 168 2 A, B 24.6 B The instrumental readings were linearly correlated to glycerin concentration at each salt concentration and with each instrument with correlation coefficients ranging from 0.94 to greater than 0.999. In the second phase of the study a separate single application test was followed by a two-week test w•th formulations containing 1.5% NaCI and levels of glycerin from 0 to 15%. In the two-week test the legs were graded for dryness on a 4-point scale. Results are shown in table 3. Glycerin proved to be an effective skin conditioning agent as reported previously(10). Table 3: Changes in readings in the one hour and two week tests and changes in grade in the two-week test. Glycerin C-Meter C-Meter NOVA NOVA Skicon Skicon Grade Level lhr 1 week 1 hr 1 week 1 Hr 1 week Reduction 0 3 8 37 20 12 22 0.88 5 16 15 148 51 85 61 0.95 10 25 19 237 97 t83 107 1 28 15 27 23 267 118 250 130 1.40 _ There was correlation between the change in the instrument reading at in the one-hour test and the change in grade in the two-week test with all three instruments. Regression equations are given in table 4 along with p-values for the slope. We do not consider the •pparent difference in the predictive power of
Purchased for the exclusive use of nofirst nolast (unknown)
From: SCC Media Library & Resource Center (library.scconline.org)