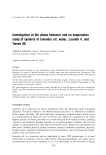
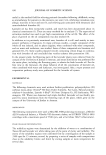
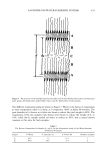
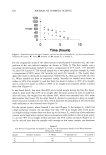
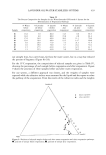
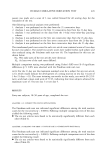
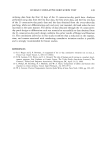
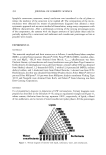
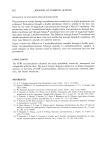
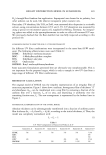
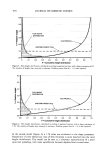
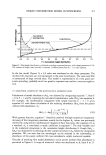
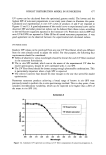
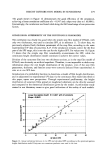
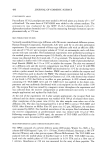
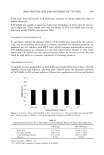
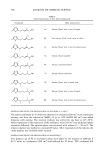
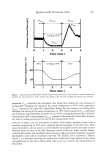
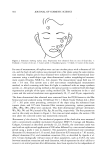
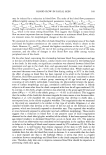
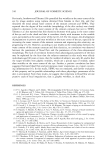
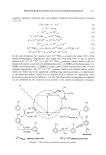
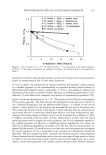
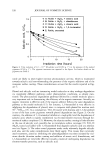
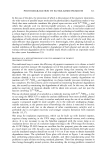
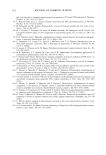
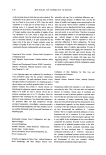
438 JOURNAL OF COSMETIC SCIENCE 120 100 80 %weight 60 40 20 0 • A A A 0 2 4 6 8 10 Time(days) Figure 7. Evaporation paths for samples with selected composition for the water/lavender oJl/Laureth 4 system during one week. ', sample E I, sample D &, sample C x, sample B *, sample A O, water +, lavender oil. pounds are located has been well established in previous works (16,19-21) (Figure 8). The unexpected result was for the pure lavender oil, where it evaporated before the low-water-content samples, where low water content enhances keeping the oil for a longer time. This means again that higher-surfactant solutions evaporate more slowly and retain their weight or both fast and slow evaporations. Finally, the results from the evaporation pathways for the selected samples (Table IV) and their evaporation paths are clarified in Figure 9. The pathways are not straight lines but curves. From previous studies (12,18) there are two expected pathways: a straight line or a curve, depending on the vapor pressure of the fragrance relative to water (Figure 3) (12). For the evaporation path of phenethyl alcohol (vapor pressure 0.11 mmHg at 25øC, Figure 8), the pathway was a straight line where water evaporated first for three reasons: the vapor pressure value of water (vapor pressure 20 mmHg at 25øC), the stability of the initial emulsion, and the density difference of the continuous phase and the disperse phase. For linalool and limenone systems, their evaporation pathways were Phenethyl Alcohol Water A B Limonene Benzaldehyde "• Laureth 4 c Figure 8. The evaporation pathways of different systems: (A) phenethyl alcohol/water/Laureth 4, (B) limonene/water/Laureth 4, and (C) benzaldehyde/water/Laureth 4. • curved pathway. --- straight-line pathway.

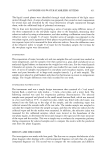
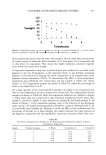
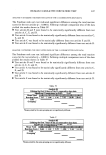
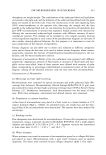
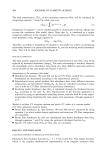
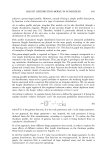
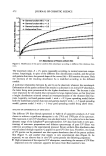
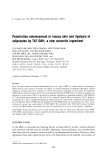
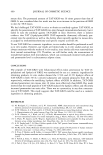
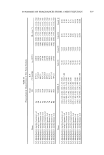
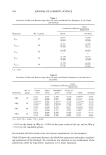
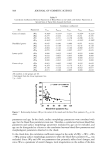
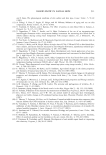
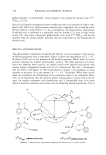
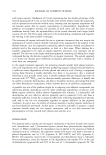
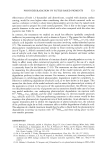
LAVENDER OIL/WATER/STABILIZER SYSTEMS 439 Table IV The Percent Composition for Samples for the Water/Lavender Oil/Laureth 4 System for the Determination of Evaporation Pathways Sample % Water % Lavender % Laureth % Water % Lavender % Laureth before oil before 4 before after oil after 4 after evaporation evaporation evaporation evaporation evaporation evaporation B1 13.0 3.0 84.0 14.5 0.0 85.5 B2 14.0 6.0 80.0 15.8 2.8 81.4 B3 17.0 14.0 69.0 18.3 11.1 70.6 B4 12.0 19.0 69.0 15.5 14.7 69.8 B5 3.0 26.0 71.0 7.3 21.3 71.4 B6 1.0 29.0 70.0 5.7 24.1 70.2 B7 1.5 37.5 61.0 6.1 32.2 61.7 B8 1.5 55.5 43.0 5.9 50.5 43.6 not straight lines, but curved ones, far from the water corner, but in a way that reduced the percent of fragrance (Figure 8) (18). For the 35øC evaporation, the compositions of selected samples are given in Table IV, showing the percentage of each sample before evaporation and after evaporation. Figure 9 shows the positions of these samples before and after warm evaporation. For our system, a different approach was chosen, and the weights of samples were reported while the refractive indices were measured for the liquid and the vapors to relate the pathway of the evaporation. From the results of the refractive index and the weights Lavender oil © Before evaporation ß After evaporation B• B6 B5 B4 B3 B2 BI Laureth 4 Water Figure 9. Positions of selected samples before and after warm evaporation and their evaporation pathways. O, position of sample before evaporation l, position of sample after evaporation.
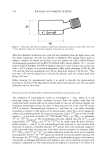
Purchased for the exclusive use of nofirst nolast (unknown)
From: SCC Media Library & Resource Center (library.scconline.org)