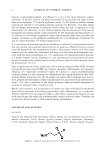
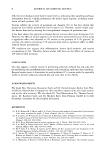
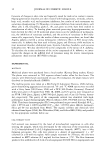
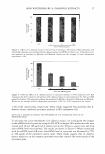
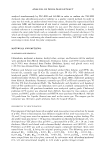
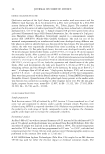
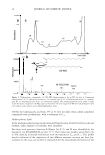
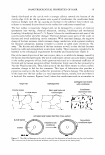
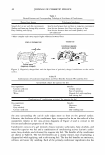
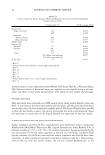
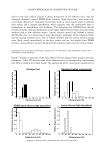
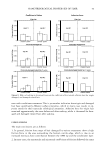
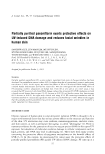
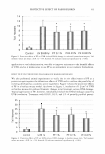
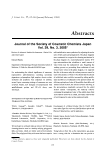
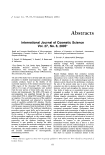
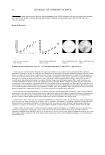
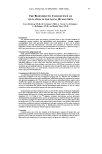
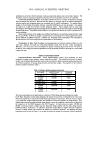
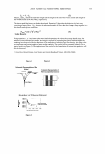
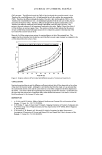
18 JOURNAL OF COSMETIC SCIENCE (A) 2 3 Tyrosinase b-actbt (B) 120 100 0 80 0 C: 60 0 :E 40 .!: ?fl. 20 0 Ctrl 20 100 Cone. of A. dahurica (µg/mL) Figure 4. Inhibitory effects of A. dahurica extract on expression of the tyrosinase gene in B 16 melanoma cells. Bl6 mouse melanoma cells were seeded into a T-75 flask at a density of 1 x 10⁶ cells per flask and treated with or without A. dahurica extract for 48 hours. (A) is the result of gel electrophoresis of the RT-PCR products. Lane 1 shows the tyrosinase (716 bp) and J3-actin gene (400 bp) of the control cell. Lane 2 shows those of cells treated with 20 µg/ml of A. dahurica extract. Lane 3 shows those of cells treated with 100 µg/ml of A. dahurica extract. (B) shows the decreased mRNA level of cells treated with A. dahurica extract expressed as % inhibition of the control. Results are the averages of three independent experiments ± SD. *p 0.05 compared to the control. ISOLATION AND IDENTIFICATION OF ACTIVE COMPOUNDS FROM A. DAHURICA The ethanolic extract of A. dahurica decreased significant intracellular melanin content and tyrosinase biosynthesis. Thus, a laboratory investigation was performed on the active ethanolic extract. Activity-guided fractionation led to the isolation of compounds 1 and 2 as active compounds. Compound 1 was obtained as an amorphous white powder, and showed [Mr at mlz 270 in the EIMS spectrum. The UV spectrum exhibited typical bands of the 5-substituted linear furanocoumarin ring at 220, 249, and 309 nm (17 ,18). In the 1 H-NMR spectrum, two doublet signals (lH,J = 9.76 Hz) at o 6.27 and 8.15 were assignable to the ortho coupled protons of the pyrone ring, and another two doublet signals (lH,J = 2.45 Hz) were detected at 6.96 and 7 .60 ppm, attributable to the protons of the furan ring. A peak of the aromatic proton was detected as a singlet signal (lH, H-8) at 7 .16 ppm, and the signal for H-4 was observed at a rather lower field (o 8.15) to indicate the absence of proton at C-5 (17,18). Therefore, a side chain was suggested to substitute at the C-5

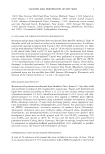
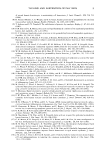
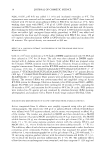
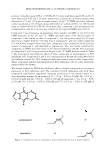
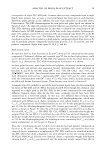
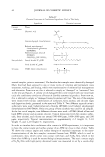
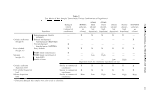
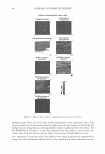
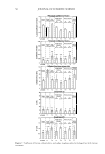
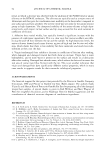
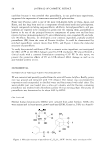
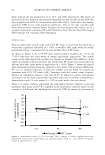
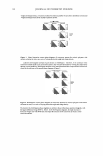
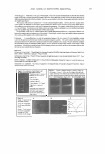
SKIN WHITENING BY A. DAHURICA EXT RACT S 19 position. A doublet signal (2H,j = 6.99 Hz, H-1") and a multiplet signal (lH, m, H-2") were detected at 4.92 and 5.54 ppm, respectively, and protons of methyl groups were detected at 1.71 and 1.81 ppm as singlet signals. In the 13 C-NMR spectrum, carbonyl carbon was shown at 161.26 ppm, along with twelve sp2 carbons (o 94.12 to 158.12) and three sp3 carbons (o 18.20 to 69.74). From these data, compound 1 was postulated to be isoimperatorin, and the structure was verified by the reported NMR data (18,19). Compound 2 was obtained as an amorphous white powder, and [Mr at rnlz 270 in the EIMS spectrum. In the 1 H- and 13C- NMR spectrum, most of the spectral aspect of compound 2 was similar to that of compound 1, but the proton signal for H-4 was detected at a higher field (o 7.76) than that of compound 1, and two carbon signals for C-5 and 8 were changed. From these data, compound 2 was assumed to be the position isomer of compound 1, and identified as imperatorin. This was finally confirmed by comparing its NMR data with those in the reported references (18,19). The structures of compounds 1 and 2 are presented in Figure 5 and 13C-NMR data are listed in Table I. We investigated the inhibitory effects of these compounds on melanogenesis in B16 melanoma cells. Compounds 1 and 2 at a concentration of 80 µMand 100 µM reduced the melanin content by 50% compared with non-treated control cells, respectively. These compounds inhibited melanogenesis of B16 melanoma cells in a dose-dependent manner (data not shown). We further studied by ELI SA the inhibitory effects of these compounds on tyrosinase expression in B16 melanoma cells. The treatment of B16 melanoma cells with these compounds significantly suppressed tyrosinase production at the protein levels in a dose-dependent manner: by an average of 20± 5% (p 0.05) at 10 µM 40± 4.5% (p 0.05) at 50 µM and 60± 5.6% (p 0.05) at 100 µM of compound 1 35± 5% (p 0.05) at 50 µM 50± 3.4% (p 0.05) at 100 µM and 75± 6.5% (p 0.05) at 200 µM of lsoimperatorin lmperatorin J" 4 � -o 5" H H _r('" -o 5" Figure 5. Chemical structure of compounds 1 and 2 isolated from the root of Angelica dahurica.
Purchased for the exclusive use of nofirst nolast (unknown)
From: SCC Media Library & Resource Center (library.scconline.org)