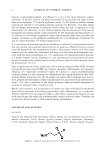
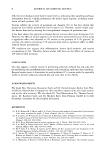
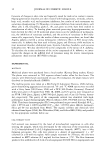
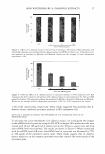
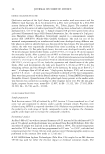
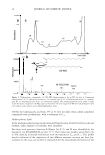
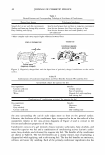
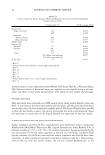
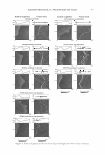
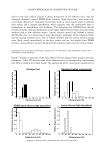
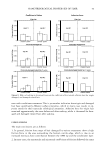
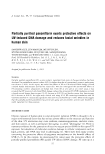
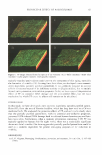
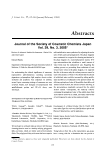
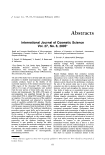
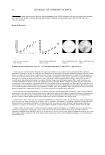
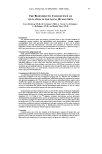
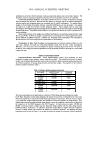
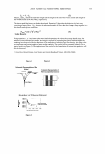
48 JOURNAL OF COSMETIC SCIENCE Adhesive force maps for various hair Damaged (untreated) Damaged treated (commercial) (BTMAC surfactant, no silicone) 0 0 2µm (PDMS blend silicone, low deposition) 0 0 2µm (PDMS blend silicone, high deposition) 0 (Amino silicone, low deposition) (Amino silicone, high deposition) (BAPDMA surfactant, no silicone) Figure 5. Adhesive force maps for damaged hair with various treatments. damaged treated hair, we can see the uneven distribution of the conditioner layer. This uneven distribution is also most evident for the amino silicone images, in which the less mobile silicone brings about a distinguishable change in adhesion over the surface. For the PDMS-blend silicone, it is seen that adhesion over the surface is much more con- sistent than with the amino silicone, where various areas of high adhesion occur. It is important to note that while the adhesive force maps presented are representative images for each treatment, adhesive force varies significantly when treatments are ap-

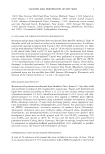
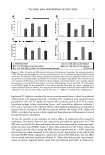
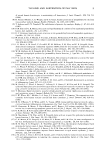
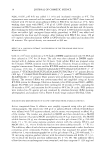
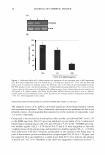
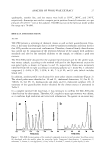
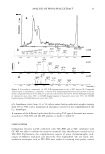
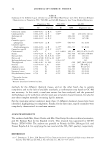
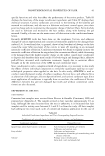
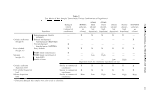
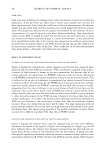
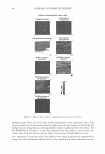
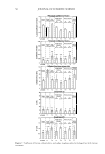
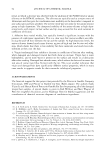
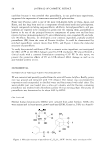
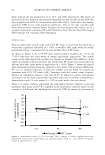
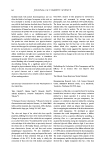
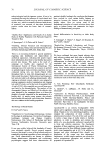
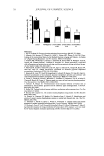
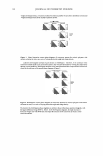
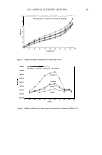
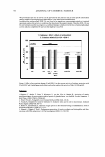
NANOTRIBOLOGICAL PROPERTIES OF HAIR 49 plied to the hair surface. Figure 6 shows histograms of all adhesive force data for damaged, damaged treated, PDMS-blend silicones (high deposition), and amino sili- cones (high deposition). Damaged treated hair shows a much larger range of adhesive force values and a normal distribution, which suggests that the conditioner layer is nonuniform in distribution and thickness. The histogram for PDMS-blend silicone treatment shows a normal distribution at the larger adhesive force values, but also shows another peak at low adhesion values. Amino silicone treated hair follows a normal distribution, but it is interesting to note the distinct groupings of the adhesion values and the spacing between them. This is further evidence that the amino silicone groups most likely attach immediately to the hair surface and are less mobile than PDMS silicone, causing distinct regions of high and low adhesion values over the cuticle surface. DISCUSSION OF SURFACE ROUGHNESS, COEFFICIENT OF FRICTION, AND ADHESIVE FORCE DATA OF VARIOUS HAIR SAMPLES Figure 7 displays a summary of the data collected for all damaged hair samples and their treatments. Table VII reviews some of the observations and corresponding mechanisms that help to explain the trends found. The application of the commercial conditioner to Q) e J2 0.5 Q) "in Q) 0.4 ..c "C IO c: 0.3 Q) ·a, iii 0.2 C: 0 � 0.1 I.! LL Damaged hair O 0 20 40 60 80 100 120 140 160 180 200 Adhesive force (nN) PDMS blend silicone (high deposition) 0.6 Q) e .$2 0.5 Q) "in Q) 0.4 ..c -0 IO � 0.3 ·a, iii 0.2 C: 0 U 0.1 � LL 0 L...-....IL..---L.'--.c==-L....J.--'--'--.L.1...--L.JL..--_ __,____, 0 20 40 60 80 100 120 140 160 180 200 Adhesive force (nN) 0.6 Q) e J2 0.5 Q) "in a, 0.4 ..c -0 IO c: 0.3 Q) ·a, iii 0.2 C: 0 U 0.1 � LL Damaged treated (commercial) 0 o 20 40 60 80 100 120 140 160 180 200 Adhesive force (nN) 0.6 Q) e J2 0.5 Q) "in Q) 0.4 ..c -0 IO � 0.3 ·a, iii 0.2 C: 0 U 0.1 � LL Amino silicone (high deposition) Adhesive force (nN) Figure 6. Adhesive force histograms for various hair specimens.
Purchased for the exclusive use of nofirst nolast (unknown)
From: SCC Media Library & Resource Center (library.scconline.org)