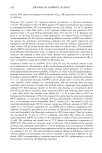
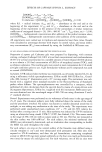
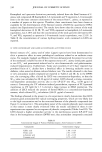
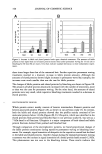
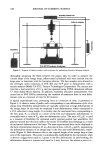
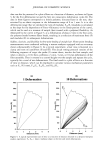
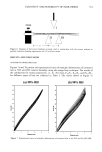
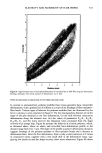
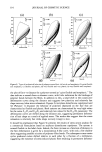
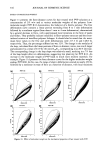
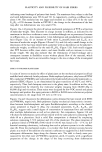
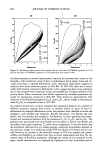
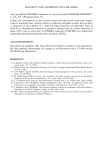
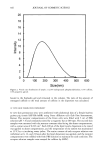
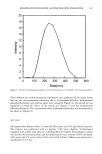
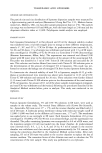
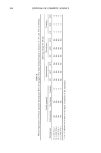
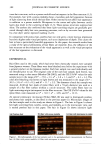
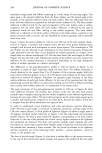
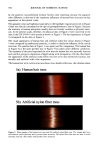
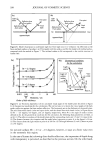
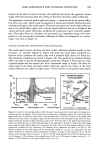
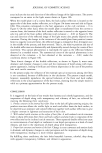
350 JOURNAL OF COSMETIC SCIENCE data can also be presented in a plot of force as a function of distance, as shown in Figure 5, for the first deformation (a) and the first ten consecutive deformation cycles (b). The data in these figures correspond to a brittle polymer, discussed later in the text, char- acterized by an elastic response in the deformation range of 0 to 1 mm. It is in this deformation range that we calculate the ratio of modulae, E•o/E • {modulus is calculated as the slope for the dependence of Force=f(distance) in the linear portion of the curve}, which can be used as a measure of sample (hair treated with a polymer) flexibility. As illustrated by the curves in Figure 5, at a deformation of about 2 mm in the first cycle, the polymer bonds between fibers break, resulting in a reduction of maximum force (F) and modulus (E) in subsequent deformations. Stiffness, elasticity, and flexibility by three-point bending of straight hair. Three-point bending measurements were conducted utilizing a texture analyzer equipped with an accessory shown schematically in Figure 6. In a typical experiment, a hair tress is fastened to a clamp and rests on cantilevers (II and III). The actual testing protocol consists of the following sequence of steps: the probe (I) comes down, touches the hair sample, and when it detects a 2.0 G force, performs a 3-mm, 5-mm, or 10-mm deformation of the fiber assembly. Then it returns to a control height over the sample and repeats the cycle, typically for a total of ten deformations. The final result is a plot of force as a function of time or distance, which can be employed to calculate various mechanical parameters such as F 1, F(1 mm), F•o/F•, E1o/E•, and H1o/H •. (a) (b) 1 Deformation 10 Deformations 400 400 350 300 250 200 150 1oo 50 0 1 2 3 4 Distance (ram) 350 300 250 •200 •50 •00 50 0 i 5 0 I 2 3 4 Distance (rnrn) Figure 5. A typical experimental trace of force as a function of distance obtained in a dynamic hairspray analysis experiment. E•, E•o = elastic modulus (slope) in the first and tenth deformations.

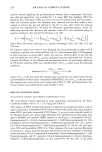
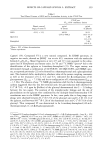
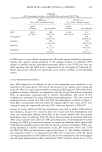
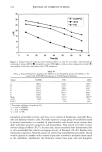
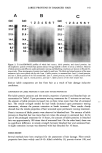
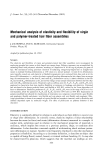
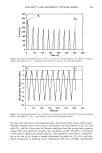
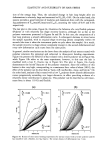
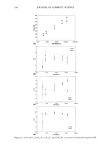
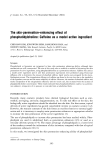
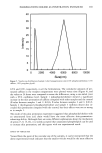
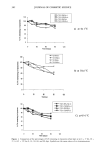
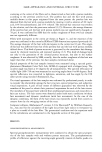
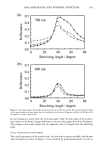
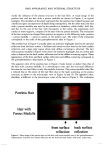
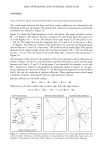
ELASTICITY AND FLEXIBILITY OF HAIR FIBERS 351 clamp Figure 6. Diagram of three-point bending accessory used in conjunction with the texture analyzer to perform cantilever bending experiments on 6.5-inch hair tresses. RESULTS AND DISCUSSION ANALYSIS OF UNTREATED HAIR Figures 7a and 7b present the experimental traces of multiple deformations of untreated hair at 50% and 90% relative humidity using the omega loop technique. The results of the calculations for various parameters, i.e., F•, F(1 mm), F•o/F•, E•o/E•, and H•o/H•, for different types of hair are collected in Table I. The curves shown in Figure 7a 45' 40' 35' 30' 20' 15' 10' 5' 0 o (a) 50% RH 1 2 3 4 Distance (mm) (b) 90% RH 50 45 40 35 30 .• 25 20 15 0 1 2 3 4 Distance (mm) Figure 7. Experimental traces of multiple deformations of untreated hair at (a) 50% and (b) 90% RH.
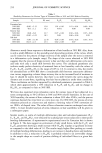
Purchased for the exclusive use of nofirst nolast (unknown)
From: SCC Media Library & Resource Center (library.scconline.org)