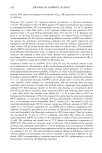
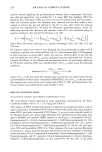
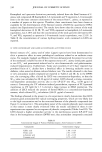
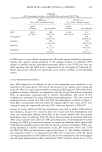
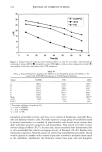
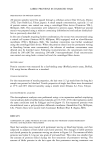
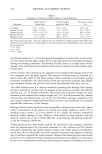
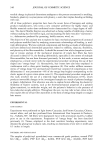
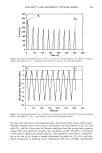
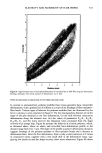
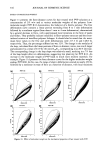
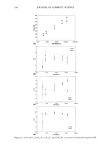
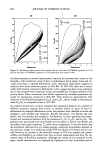
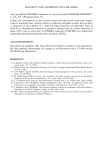
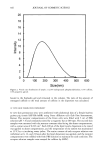
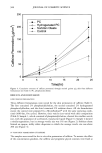
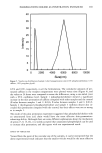
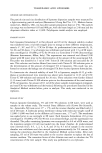
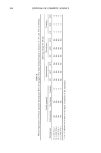
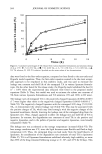
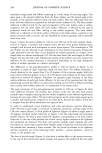
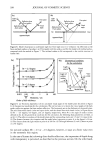
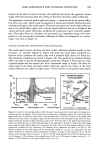
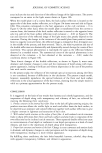
352 JOURNAL OF COSMETIC SCIENCE Table I Flexibility Parameters for Various Types of Untreated Hair at 50% and 90% Relative Humidity Sample F• F(1 mm) F•o/F • E•o/E • H•o/H • Caucasian hair 50% RH 49.85 -+ 5.15 15.0 1.01 + 0.01 1.01 +_ 0.01 0.96 +- 0.01 90% RH 49.3 +- 1.2 14.2 0.872 0.88 0.98 Chinese hair 50% RH 68.8 _+ 6.8 22.7 0.97 _+ 0.02 0.96 +- 0.03 0.97 -+ 0.01 90% RH 69.85 + 1.05 18.1 0.89 0.86 + 0.04 0.99 Yak hair 50% RH 73.85 + 11.85 22.45 0.96 + 0.05 0.94 +- 0.03 0.95 +- 0.01 90% RH 84.15 _+ 2.5 25.5 0.82 +_ 0.05 0.87 illustrate a nearly linear response to deformation of hair bundles at 50% RH. Also, there is only a small difference in the ascending and descending portions of the curves, which can be related to the process of shape recovery of the sample after the stress is removed in a deformation cycle (sample creep). The shape of the curves obtained at 50% RH suggests that the process of shape recovery is fast and that each deformation cycle starts and ends with only a small shift between the curves. The calculated parameters also indicate nearly perfect elasticity of untreated hair at low humidity with the values of F•o/F •, E•o/E•, and H•o/H 1 in the range of 0.95 to 1.0. In contrast to this, the results for untreated hair at 90% RH show a considerable shift between consecutive deforma- tion curves, suggesting a slower shape recovery due to the increased level of moisture in hair. It should be noted, however, that there is no shift between the curves along the distance axis at zero force, signifying that hair has no plasticity under these conditions. These conclusions are further supported by calculated parameters, presented in Table I, which show approximately a 10% reduction in F•o/F • and E•o/E•, and no change in H•o/H•, as compared to hair at 50% RH. We have also examined stress relaxation curves for various types of hair subjected to a stress corresponding to 50 G of force at 50% and 90% relative humidity. In the case of 50% humidity, the extent of force relaxation is about 26% after 4500 s, and the process continues beyond this time limit at a very slow rate. For 90% RH, the process of stress relaxation proceeds at a faster rate and reaches a limiting value of 50% conversion af- ter 1000 s of elapsed time. The value of force relaxation remains unchanged even after 4500 s. A more detailed analysis of stress relaxation in hair assemblies will be given in a subsequent paper. Similar results, in terms of multiple deformation plots and calculated parameters (F•o/ F•, E1o/E •, and H•o/H•), were obtained by studying hair tresses subjected to three-point bending deformations. A representative experimental trace for Caucasian hair is shown in Figure 8. The data suggest an evolvement of only small forces, with the F•o/F • and E•o/E • parameters showing a small increase while H•o/H • displays a significant decrease as compared to the ideal value of 1.0. The results imply higher fiber packing as a result of multiple bending deformations, leading to an increase in bending forces and modulae. In addition to this, a reduction in H•o/H • is probably related to an irreversible change in the sample shape as a result of position shifting of individual fibers in a given hair tress.

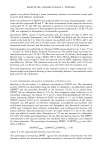
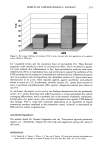
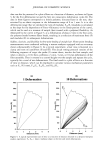
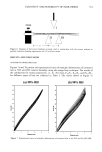
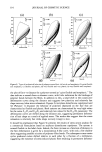
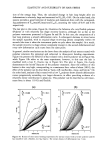
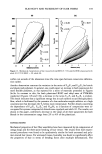
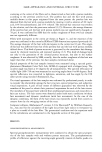
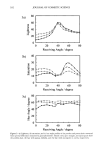
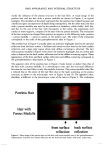
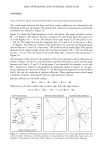
ELASTICITY AND FLEXIBILITY OF HAIR FIBERS 353 2 3 4 5 6 7 Distance (mm) Figure 8. Experimental traces of multiple deformations of untreated hair at 50% RH using the three-point bending technique. The initial distance of deformation was 5 mm. TYPES OF MECHANICAL BEHAVIOR OF POLYMER-TREATED HAIR In contrast to untreated hair, polymer-modified hair tresses generally show irreversible deformations, with a gradual loss of stiffness as a result of the breakage of fiber-polymer- fiber bonds. Various types of behavior for polymer-modified hair are illustrated by the force-vs-distance curves presented in Figure 9. The key distinguishing features are (i) the shape of the plot obtained in the first deformation, (ii) the shift between consecutive deformations along the distance axis, (iii) the values of parameters F]o/F •, Elo/E•, Hlo/H•, F], and F(1 mm), and (iv) the relaxation times estimated from the shape recovery of an omega loop. Figure 9a portrays the behavior of a brittle polymer, which, as discussed above, shows an elastic and reversible force-deformation profile in the distance range from 0 to 1 mm. The shape of the profile at greater deformation distances suggests breakage of the polymer-polymer or fiber-polymer bonds and a decrease in deformation force. After the first deformation, there is only a small reduction in F values in consecutive cycles, together with a very small shift in the deformation loops, sug- gesting low plasticity and fast shape recovery (slow stress relaxation). Figure 9b shows
Purchased for the exclusive use of nofirst nolast (unknown)
From: SCC Media Library & Resource Center (library.scconline.org)