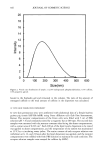
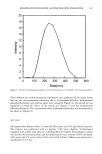
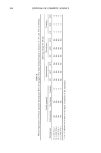
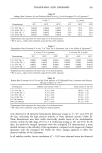
TRANEXAMIC ACID LIPOSOMES 383 Table IV Leakage Rate Constants (k) and Predicted Shelf Lives (t9o) of the Entrapped TA in Liposomes •'b k (day -1) t9o (days) Formulations 4øC 30øC 45øC 4øC 30øC 45øC 7:2:1 (5% TA,+) 0.0030 0.0046 0.0055 35.1 22.8 19.0 7:2:1 (10% TA,+) 0.0030 0.0039 0.0046 35.1 26.8 22.8 7:2:1 (5% TA,-) 0.0023 0.0032 0.0039 45.6 32.6 26.8 7:2:1 (10% TA,-) 0.0016 0.0023 0.0030 65.1 45.6 35.1 Experimental data represent the mean value of six determinations. The k and t9o values were estimated using the first-order equation. Table V Degradation Rate Constants (k in day -•) of Total TA in Liposomes, and in the Pellets of Liposomes •'b k of total TA in liposome k of total TA in pellet Formulations 4øC 30øC 45øC 4øC 30øC 45øC 7:2:1 (5% TA,+) 0.0002 0.0009 0.0016 0.0030 0.0055 0.0069 7:2:1 (10% TA,+) 0.0005 0.0016 0.0014 0.0028 0.0053 0.0058 7:2:1 (5% TA,-) 0.0002 0.0007 0.0009 0.0062 0.0062 0.0023 7:2:1 (10% TA,-) 0.0014 0.0012 0.0012 0.0023 0.0018 0.0035 Experimental data represent the mean value of six determinations. The k and t9o values were estimated using the first-order equation. Table VI Release Rate Constants (k) of TA and the Total Amount of TA Released From Liposomes and Solution During 24 Hours at 37øC •'b Formulation Release rate constant (%/h •/2) Total release of TA (%) 7:2:1 (5% TA,+) 6.12 + 0.06 28.05 + 1.45 7:2:1 (10% TA,+) 8.13 + 0.05 36.20 + 1.24 7:2:1 (5% TA,-) 6.29 + 0.07 29.22 + 1.71 7:2:1 (10% TA,-) 8.27 + 0.04 37.93 -+ 1.04 5% TA solution 18.89 + 0.21 81.69 + 5.03 10% TA solution 19.77 + 0.20 87.32 + 4.90 Experimental data represent the mean value of six determinations. The values were estimated using the Higuchi model equation. were observed in all liposome formulations following storage at 4 ø, 30 ø, and 45øC for 90 days, indicating the high physical stability of these liposome systems (Table II). These formulations may have stable electrically double layers of the multilamellar vesicles, within the pH range of 6.9 to 7.9. Following storage at 30 ø and 45øC for 90 days, the positively charged liposomes with the entrapped TA demonstrated a more marked increase in the turbidity of the supermatant, compared to the negatively charged liposomes with the entrapped TA (Table II). Thus, charges appeared to affect the physical stability of the liposomes. In all stability studies, better correlations (r 2 = 0.91) were obtained when the observed

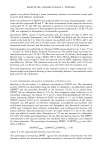
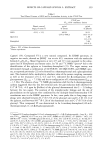
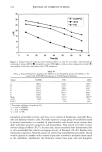
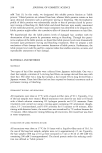
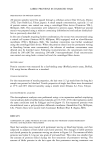
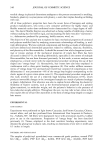
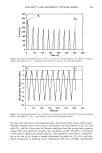
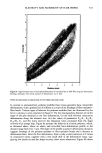
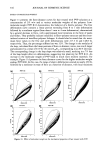
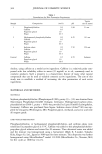
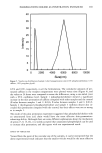
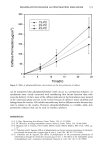
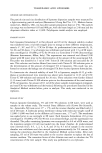
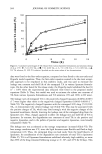
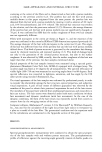
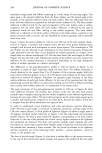
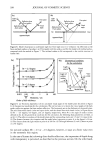
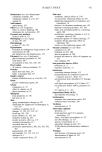
384 JOURNAL OF COSMETIC SCIENCE lOO I 80 60 40 20 0 5 10 15 20 25 Time (h) Figure 2. Cumulative percentages of TA released from various liposome formulations and solutions during 24 h at 37øC: ', 7:2:1 (5% TA,+) O, 7:2:1 (10% TA,+) /•, 7:2:1 (5% TA,-) 7:2:1 (10% TA,-) •,, 5% TA solution X, 10% TA solution. Symbols are the mean values of six determinations. data were fitted to the first-order equation, compared to those fitted to the zero order and Higuchi model equations. Thus, the first-order equation seemed to be the most accept- able approach to be employed in this stability study, and was used to estimate the leakage rate constant and shelf life of the entrapped TA in various liposome formula- tions. On the other hand, for the release study, the Higuchi model exhibited the best fit (r 2 -- 0.97) when the experimental data obtained were fitted to the proposed model equations (Table I). Thus, this model was used to estimate the release rate constant of TA from various liposome formulations and TA solutions (5% and 10%) in DI water. The leakage rates of entrapped TA in the positively charged liposomes (0.0030-0.0055 d -•) were higher than those in the negatively charged liposomes (0.0016-0.0039 d -•, Table VI). The negatively charged liposome with the entrapped 10% drug {7:2:1(10% TA,-)} demonstrated the slowest leakage rate (Table VI). This may be associated with the positive charges of TA, which may bind strongly with the negative charges of the liposomal membrane, thereby lowering the leakage rate of the entrapped drug from the liposomes (21). Thus, charges appeared to affect the leakage rate and shelf life of TA in liposomes. In contrast, the degradation rate constants of total TA in the positive and negative liposomes, and in the pellets of positive and negative liposomes, were broadly comparable (Table V). The leakage rate was accelerated as the storage temperature increased (Table VI). The best storage condition was 4øC, since the lipid becomes more flexible and fluid at high temperature (22). Thus, the entrapped drug can leak easily from the lipid bilayers of liposomes. In consideration of the degradation rate constants of total TA in liposomes (Table V), TA in all liposome formulations exhibited relatively high stability, as more than 90% of the drug remained following storage at 4 ø, 30 ø, and 45øC for 60 days. This
Purchased for the exclusive use of nofirst nolast (unknown)
From: SCC Media Library & Resource Center (library.scconline.org)