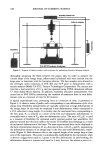
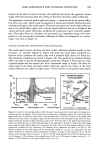
TRANEXAMIC ACID LIPOSOMES 377 LIPOSOME SIZE DETERMINATION The particle size and size distribution of liposome dispersion samples were measured by a light-scattering particle analyzer (Mastersizer S Long Bed Ver. 2.11, Malvern Instru- ments Ltd., Malvern, UK), ten days after sample preparation (kept at 4øC). The particle size range was set between 0.05 and 800 t•m, with the beam length at 2.40 mm and the dispersant refractive index at 1.3300. Polydisperse model analysis was employed. STABILITY STUDY Each liposome formulation (5 ml for physical and 20 ml for chemical stability studies) was transferred into a vial with stopper prior to storage at three different temperatures, namely 4 ø, 30 ø, and 45 ø (+ iø)C for 90 days. At predetermined time intervals (0, 14, 30, 60, and 90 days), 1.5 g of sample was withdrawn and mixed with 1.5 g of DI water, then centrifuged at 150,000 g (4øC) for 90 min in a Centrikron T-1180 ultracentrifuge (Kontron Instruments, Milan, Italy). The supernatant was removed and diluted (100 times) with DI water prior to the determination of the amount of the unentrapped TA. The pellet was dissolved in 5 ml of 10% Triton-X 100 solution and sonicated for 20 min. This solution was further diluted (ten times) with Triton-X 100 solution prior to the determination of the amount of entrapped TA in liposomes. This study was per- formed to estimate the leakage rate of entrapped TA from various liposome formulations. To characterize the chemical stability of total TA in liposomes, samples (0.25 g) with- drawn at predetermined time intervals (see above) were dissolved in 12.25 ml of 10% Triton-X 100 solution and sonicated for 20 min. These solutions were further diluted (3.33 times) with Triton-X 100 solution prior to the determination of the total amount of TA in liposomes. An amount of 0.1 ml of the above samples (unentrapped, entrapped, and total TA) was withdrawn and derivatized, following the procedures described in the Analytical Method section below, prior to analysis. This study was conducted in six replicates. RELEASE STUDY Various liposome formulations, 5% and 10% TA solutions in DI water, were used as samples in the release study. The vertical Franz diffusion cells (Crown Bio Scientific, Inc., Somerville, NJ) were set at 37 ø + iøC, and the receiver chamber was filled with 12 ml of DI water. A molecular porous membrane tubing with molecular weight cutoff of 12,000-14,000 was fixed in the diffusion cell (contact area, 1.77 cm2). The membrane was soaked prior to use overnight in DI water. Each liposome formulation (3.0 g) was centrifuged at 150,000 g (4øC) for 90 min in an ultracentrifuge, and the supernatant was discarded. The pellet containing liposomes was resuspended in 6.0 ml of DI water, and the dispersion sample (2.0 ml) was loaded into the donor chamber. At predetermined time intervals (0.25, 0.5, 1, 2, 4, 6, 8, and 24 h), 0.5 ml of sample in the receiver chamber was withdrawn and then assayed spectrophotometrically for TA content, fol- lowing the procedures described in the Analytical Method section below. After each sampling, 0.5 ml of DI water was added to the receiver chamber to replace the loss of receiver medium. The correction factor of this dilution was used to calculate the TA concentration of the next sample. This study was performed in six replicates.

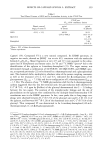
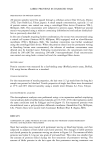
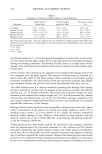
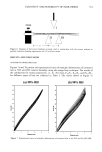
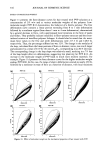
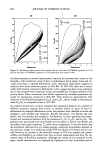
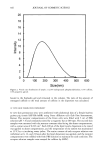
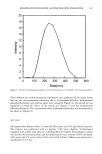
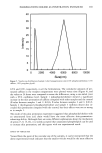
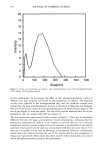
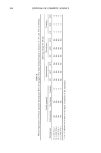
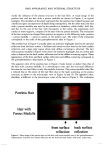
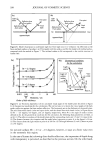
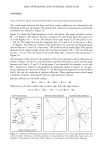
378 JOURNAL OF COSMETIC SCIENCE ANALYTICAL METHOD The concentration of TA in samples was determined spectrophotometrically at 415 nm (Milton Roy Spectronic 1001 Plus, Rochester, NY), following derivatization with 2,4,6- trinitrobenzosulfonic acid (20). The color reagent employed in this study was 1.68% (w/v) 2,4,6-trinitrobenzosulfonic acid solution in DI water, and was freshly prepared and protected from light. Each 0.1 ml of the working standard solution or samples was spiked with 0.25 ml of 0.025 M disodium tetraborate solution (pH 10) and 0.25 ml of color reagent, prior to standing at 25øC for 30 min. The solution was then diluted to 5.0 ml with 0.1 M potassium dihydrogen phosphate solution (pH 4.5) to terminate the reaction. The formed color intensity was relatively stable in the reaction medium for at least 3 h when protected from light. The solution mixture in the absence of TA was used as a blank. A calibration graph was constructed. DATA ANALYSIS The proposed models (zero order, first order, and Higuchi models) were tested by fitting the experimental data to the appropriate equations (Table I). The correlation was used as an indicator of goodness-of-fit of the equation to the experimental data. The leakage, degradation, and release rate constants (k) of TA from the liposomes were estimated from the slope of TA concentration versus time plots, by least-squares fitting of the rate equation (Table I). The predicted shelf life (t9o), namely the time required when the entrapped TA content in the liposome remains at 90%, was estimated by substituting k into the shelf life equation for first-order kinetics (Table I). RESULTS LIPOSOME SIZE All liposome formulations demonstrated log-normal distribution of particle size. The liposome sizes of the 7:2:1 (5% TA,+), 7:2:1 (10% TA,+), 7:2:1 (5% TA,-) and 7:2:1 (10% TA,-) were 17.5, 35.8, 2.8, and 2.0 pm, respectively. The particle sizes of the positively charged liposomes (17.5-35.8 t•m) were approximately ten times larger than the negatively charged liposomes (2.0-2.8 pm). The smallest size (20 pm) was observed in the 7:2:1 (10% TA,-) liposome. Table 1 Equations for Calculations of Leakage or Degradation or Release Rate Constants, and Shelf Lives of TA in Liposomes a Types of equation Equations Zero-order C• = Co + kt First-order In C t = In C O + kt Higuchi model C t: C O + kt 1/2 Shelf life (first-order) %0 = 0.105 / k a C o = initial concentration C t = concentration at given t k = leakage or degradation or release rate constant t = time t9o = shelf life.
Purchased for the exclusive use of nofirst nolast (unknown)
From: SCC Media Library & Resource Center (library.scconline.org)