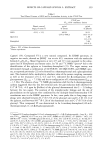
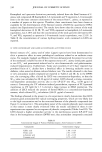
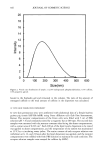
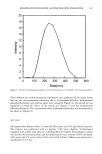
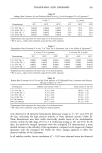
378 JOURNAL OF COSMETIC SCIENCE ANALYTICAL METHOD The concentration of TA in samples was determined spectrophotometrically at 415 nm (Milton Roy Spectronic 1001 Plus, Rochester, NY), following derivatization with 2,4,6- trinitrobenzosulfonic acid (20). The color reagent employed in this study was 1.68% (w/v) 2,4,6-trinitrobenzosulfonic acid solution in DI water, and was freshly prepared and protected from light. Each 0.1 ml of the working standard solution or samples was spiked with 0.25 ml of 0.025 M disodium tetraborate solution (pH 10) and 0.25 ml of color reagent, prior to standing at 25øC for 30 min. The solution was then diluted to 5.0 ml with 0.1 M potassium dihydrogen phosphate solution (pH 4.5) to terminate the reaction. The formed color intensity was relatively stable in the reaction medium for at least 3 h when protected from light. The solution mixture in the absence of TA was used as a blank. A calibration graph was constructed. DATA ANALYSIS The proposed models (zero order, first order, and Higuchi models) were tested by fitting the experimental data to the appropriate equations (Table I). The correlation was used as an indicator of goodness-of-fit of the equation to the experimental data. The leakage, degradation, and release rate constants (k) of TA from the liposomes were estimated from the slope of TA concentration versus time plots, by least-squares fitting of the rate equation (Table I). The predicted shelf life (t9o), namely the time required when the entrapped TA content in the liposome remains at 90%, was estimated by substituting k into the shelf life equation for first-order kinetics (Table I). RESULTS LIPOSOME SIZE All liposome formulations demonstrated log-normal distribution of particle size. The liposome sizes of the 7:2:1 (5% TA,+), 7:2:1 (10% TA,+), 7:2:1 (5% TA,-) and 7:2:1 (10% TA,-) were 17.5, 35.8, 2.8, and 2.0 pm, respectively. The particle sizes of the positively charged liposomes (17.5-35.8 t•m) were approximately ten times larger than the negatively charged liposomes (2.0-2.8 pm). The smallest size (20 pm) was observed in the 7:2:1 (10% TA,-) liposome. Table 1 Equations for Calculations of Leakage or Degradation or Release Rate Constants, and Shelf Lives of TA in Liposomes a Types of equation Equations Zero-order C• = Co + kt First-order In C t = In C O + kt Higuchi model C t: C O + kt 1/2 Shelf life (first-order) %0 = 0.105 / k a C o = initial concentration C t = concentration at given t k = leakage or degradation or release rate constant t = time t9o = shelf life.

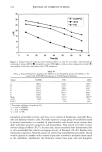
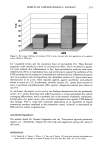
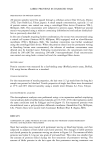
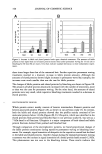
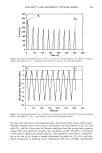
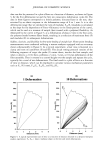
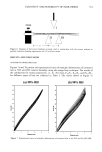
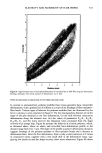
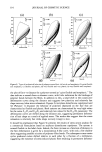
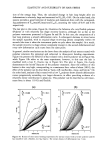
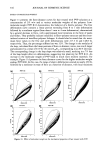
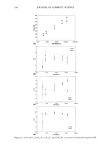
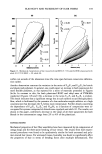
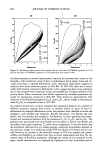
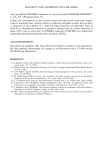
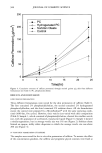
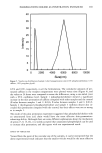
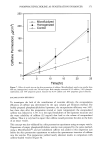
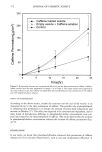
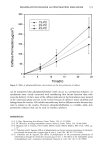
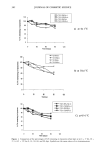
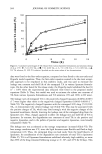
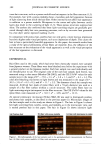
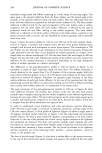
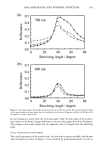
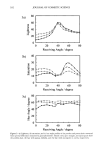
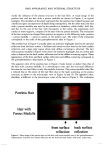
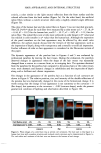
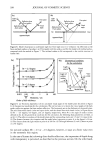
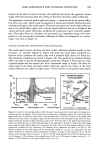
TRANEXAMIC ACID LIPOSOMES 379 DETERMINATION OF TA CONTENT The calibration graph of TA solution in DI water was demonstrated to be linear (r 2 = 0.9937), over the concentration range 4.0-20.0 lag/mi. The regression equation was as follows: y = 20.7903 x - 0.1942, where y is the concentration of TA (lag/ml) and x is the absorbance of the derivative of TA formed with 2,4,6-trinitrobenzosulfonic acid (mAU*s). The recoveries of TA from liposome formulations using spectrophotometric assay varied between 91.4% and 104.7%. The other components in liposome formula- tions neither reacted with the color reagent nor exhibited significant absorption at 415 nm. STABILITY OF LIPOSOMES The physical appearances of the 7:2:1 (5% TA,+), 7:2:1 (10% TA,+), 7:2:1 (5% TA,-), and 7:2:1 (10% TA,-) liposomes, either freshly prepared or stored at 4 ø, 30 ø, and 45 ø (+ iø)C for 90 days are shown in Table II. The physical notation of deterioration of liposome formulations, especially the positively charged liposome, can be observed from an increase in the turbidity of supernatant following storage at 30 ø and 45øC for 90 days (Table II). The amount of the remaining TA entrapped in various liposome formulations during storage at 4 ø, 30 ø, and 45øC for 90 days (Table III, Figure 1) was analyzed, using the proposed models (Table I), to estimate the leakage rate constant and shelf life of entrapped TA in liposomes (Table IV). The predicted shelf lives of TA in all liposome formulations varied between 19.0 and 65.1 days, with the longest shelf life observed in the 7:2:1 (10% TA,-) liposome (Table IV). The degradation rate constants of total TA in liposomes, and in the pellet of liposome formulations, estimated using the first-order equation, are presented in Table V. The degradation rate constants of total TA in all liposome formulations (0.0002-0.0016 d -•) were about four to nine times lower than those in the pellet of liposomes (0.0018-0.0069 d -•, Table V). DRUG RELEASE The cumulative percentages of the amount of TA released from various liposome for- mulations, 5% and 10% TA solutions in DI water during 24 hours at 37øC, are presented in Figure 1. The experimental data obtained were analyzed using the Higuchi model (Table I) to estimate the release rate constant of TA from liposomes (Table VI). The cumulative percentages of TA released from the positive and negative liposomes with the same drug concentration were not significantly different (Figure 2). However, high TA concentration in the liposomes appeared to exhibit a higher release rate con- stant of TA (Figure 1, Table VI). The total amount of TA released from liposome formulations during 24 h varied between 28.0% and 37.9%, with the highest amount observed in the 7:2:1 (10% TA,-) liposome (Table VI). DISCUSSION All liposome formulations appeared to be colloidal systems, either freshly prepared or stored at 4 ø, 30 ø, and 45øC for 90 days (Table II). No sedimentation and flocculation
Purchased for the exclusive use of nofirst nolast (unknown)
From: SCC Media Library & Resource Center (library.scconline.org)