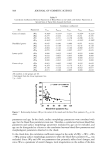
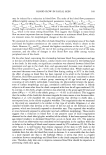
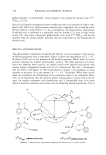
464 JOURNAL OF COSMETIC SCIENCE that film thickness profiles can account for experimental variability in SPF measure- ment. UV data collected from Transpore © tape and Vitro-skin © served to validate the calculation. Recently, B. Herzog (11) also used the step film model to directly correlate calculated sun protection factors to in vivo data. However, the same simplistic model of sunscreen film geometry was postulated in all studies. The aim of the present work was to evaluate a more complex model, with a continuous height distribution, and to test its efficiency to predict realistic sun protection factors. EXPERIMENTAL DETAILS SUBSTRATE SELECTED FOR IN VITRO SPECTROSCOPY Sunscreen products should be applied to a UV-transparent substrate. It must be non- fluorescent, photostable, and nonreactive, and should distribute the product in a manner similar to human skin and so should have a textured upper surface. From our experience, a roughened Polymethylmethacrylate © plate (PMMA), with a reproducible roughness (measured R a of about 5-6 lam), is a very convenient material, and so it was chosen for this study (12). This substrate can be supplied by Helioscience under the trade name Helioplates ©. OPERATING CONDITIONS FOR IN VITRO SPECTROSCOPY A Labsphere © UV-1000 S transmittance analyzer was used. The principle of the method consisted in the determination of the diffuse transmission spectrum of the UV rays through the substrate, before and after application of the sunscreen. A PMMA plate covered with a film of solvent (glycerol) was used to obtain the blank transmittance (from 290 to 400 nm, each nm). A first study, performed in our laboratory on numerous products, showed that the best correlation with in vivo SPF was achieved for an application rate of 1.2 mg cm -2 (12). Then, 30 mg of sunscreen product was deposited onto the roughened PMMA surface (50 mm x 50 mm). The product was immediately spread over the whole surface, using light strokes with a gloved finger, until a uniform surface density distribution was achieved. The sample thus obtained was allowed to settle for 15 minutes at room temperature to ensure a self-leveling of the formula. Nine UV transmission spectra (from 290 to 400 nm, 5-nm increment steps) were taken on each substrate at different locations. Five different substrates were used for each sunscreen, to average the UV transmission data at each wavelength. OPERATING CONDITIONS FOR SPECTROSCOPY OF PURE UV FILTERS A UV-VIS spectrophotometer (Lambda 16 ©, Perkin Elmer) was used to collect UV data. An appropriate amount of pure UV filter was carefully diluted in a suitable solvent, and the transmittance spectrum of the solution was measured by using a UV quartz cuvette with a standardized optical pathlength. The absorbance data (400-290 nm, 5-nm in- crement steps) was normalized at 1 mg cm -3 and 1 cm optical pathlength (absortivities

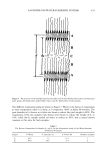
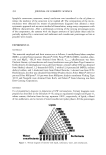
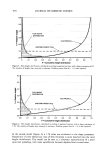
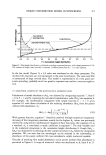
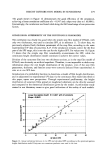
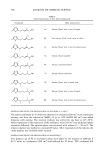
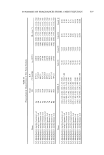
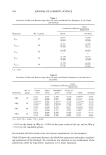
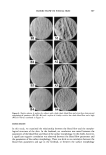
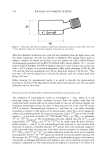
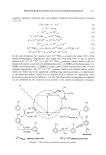
HEIGHT DISTRIBUTION MODEL IN SUNSCREENS 465 K x) through Beer-Lambert law application. Isopropanol was chosen for its polarity, but other solvents can be used, like relative transparent polar cosmetic oils. Particulate UV absorbers, like TiO 2 or ZnO, were measured after dispersion in a suitable solvent, using concentrations between 0.5 % and 3.5 %. UV absorption was measured by using a special ten-micrometer quartz cell, supplied by Hellma, Germany. An integrat- ing sphere was added to the spectrophotometer in order to collect all scattered UV rays. We previously checked that the Beer-Lambert law was fully respected according to this protocol (8). SUNSCREEN PRODUCTS SELECTED FOR IN VITRO SPECTROSCOPY Six different UV filter combinations were incorporated in the same base (O/W emul- sion). The following abbreviations were used (Table I): EHMC: Ethylhexyl methoxycinnamate MBC: 4-Methylbenzylidene camphor EHS: Ethylhexyl salicylate OXY: Oxybenzone BMDBM: Butyl methoxydibenzoylmethane Some sunscreen formulations presented here are obviously very nonphotostable. This is not important for the proposed target, which is only to sample in vitro UV data from a large range of different UV filter combinations. METHOD OF CALCULATION The original model of O'Neill was the simplest representation of an irregular film of sunscreen preparation. Figure 1 shows how a uniform, homogenous film of thickness "d" and absorbance A(x ), can be transformed into a step film by removing a fraction of the uniform film over a fraction, f•, of its area, and depositing it uniformly over the remaining fraction area, f2. The new arrangement is represented by the broken lines in Figure 1. MATHEMATICAL SIMPLIFICATION OF THE O'NEILL MODEL Absolute thickness can be advantageously transformed into a fraction of uniform parent film thickness (h• = d•/d and h 2 = d2/d), according to the initial thickness, d. Thus, the model was completely normalized, with: f•+f2= 1 (1) Table I UV Filter Composition of Sunscreen Products A-F Sunscreen A Sunscreen B Sunscreen C Sunscreen D Sunscreen E Sunscreen F EHMC 7% 7% 7% 7% 7% 7.5% MBC 4% EHS 5% OXY 3% 4% 2% 2.5% BMDBM 2% 5% 3% 1.5% 2%
Purchased for the exclusive use of nofirst nolast (unknown)
From: SCC Media Library & Resource Center (library.scconline.org)