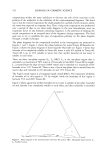
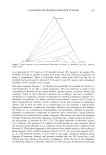
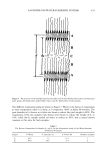
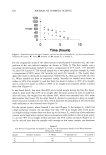
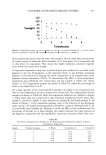
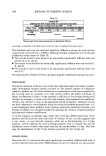
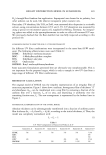
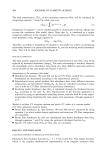
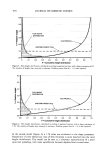
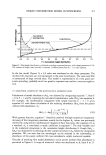
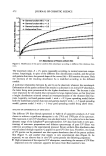
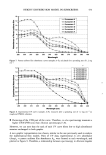
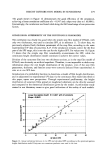
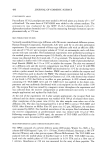
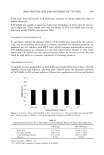
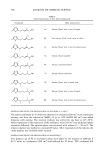
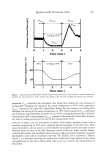
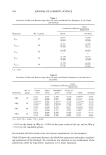
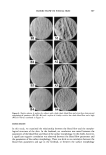
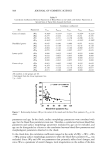
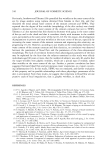
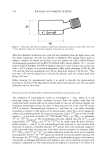
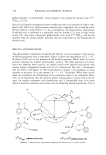
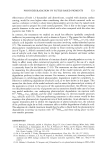
472 JOURNAL OF COSMETIC SCIENCE 4,5 ß 4 • 3,5 o .m 3 -• 2.,5 o E o• 2 '5 1,5 iz 1 II 0.5 + Gamma function with c = 3.0 -e- Gamma function with c = 1.5 t ........................................ j_______._____.. -m- Gamma function with c = 0.5 5 10 15 20 25 A = Absorbance of Parent uniform film Figure 6. Modification of the parent uniform film absorbance according to different film thickness func- tions. The maximum value, A = 25, seems reasonable according to normal sunscreen compo- sitions. Surprisingly, in spite of the different film distributions studied, and the prism and gamma functions, the general shape of the curves (As) = f(A) remains the same. Only the intensity of the resulting absorbance As is modified according to the different models. A nonlinear relationship between As and A can be observed, whatever the wavelength. Deformation of the parent uniform film results in a decrease in its initial UV absorbance, the latter being more pronounced for the higher absorbance values. The decrease is also more important for the models that correspond to large depleted areas, so that they have a height distribution oriented toward an overrepresentation of the thinnest film frac- tions. Logically, we found gamma model 1 with c = 0.5 (poor spreading model) below both the mathematical prism function and gamma model 2 with c = 1.5 (good spreading model), gamma model 3 with c = 3 (very good spreading model) being above them. ANALYSIS OF EXPERIMENTAL IN VITRO DATA The different UV filter blends (presented in Table I) of sunscreen products A-F were chosen to achieve a significant absorption in the UVA and UVB part of the spectrum. The maximum in vitro UV absorbance was also kept below 1.8 in order to be in the linear dynamic range of the Labsphere © spectrophotometer. UV data from both in vitro spec- troscopy of sunscreen preparations and dilution spectroscopy of pure UV filters was collected, according to the experimental protocol. Parent uniform film absorbance data was calculated through equation 4, applied to pure UV filter data. Therefore, two kinds of UV spectra can be presented: one that reports absorbance data of the parent uniform film (Figure 7), and another that reports in vitro experimental data (Figure 8). As expected, we can observe that in vitro UV curves present the following properties: ß High attenuation of the expected UV absorption, considering the amount of UV filter deposited onto the substrate apparent deviation from Beer-Lambert's law.

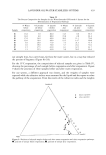
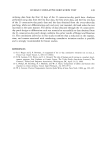
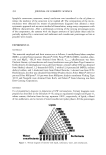
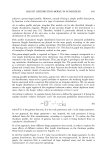
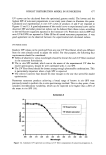
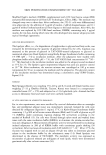
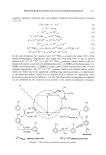
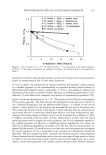
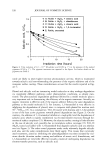
HEIGHT DISTRIBUTION MODEL IN SUNSCREENS 473 16 14 12 10 8 6 4, 0 290 300 310 320 330 340 350 Wavelength Sunscreen A --SunscreeiiiiiiiiliiiiCDESunscreenSunscreenSunscreen S__u.nscreen F 360 370 380 390 400 Figure 7. Parent uniform film absorbance curves (samples A-F), calculated for a spreading rate of 1.2 mg cm -2. 1,8 ........................................................................................................................................ -e- Sunscreen A • ............. .... ] --a-- Sunscreen B 1,6 ............................ • .............................................. 'l -e- Sunscreen C , . ...... .-•... J -•-Sunscreen D • 1,4 .-•-,-- ' ' '• ........................................ / +Sunscreen E • • ..... •.•-••_• I + Sunscreen F • •,2 • 0,8 '• 0,6 • 0,4 0,2 0 290 300 310 320 330 340 350 360 370 380 390 400 Wavelength (nm) Figure 8. Experimental UV curves (samples A-F), measured after a spreading rate of 1.2 mg cm -2 on roughened PMMA substrate. J I ß Flattening of the UVB part of the curve. Therefore, in vitro spectroscopy measures a higher UVA/UVB ratio than dilution spectroscopy (7,8). However, we can note that the rank of each UV curve (from low to high absorbance) remains unchanged in both graphs. A new graphic representation was chosen, similar to the one previously used to analyze the mathematical film models. Pairs of UV data, experimental in vitro absorbance (Aexp) x vs parent uniform film absorbance Ax, were formed at each wavelength, and plotted in Figure 9. Therefore, a relationship between spectroscopy in dilution (regular
Purchased for the exclusive use of nofirst nolast (unknown)
From: SCC Media Library & Resource Center (library.scconline.org)