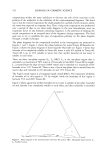
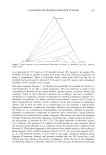
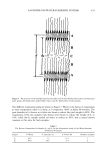
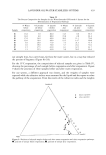
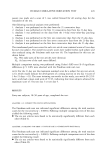
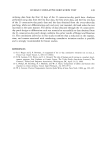
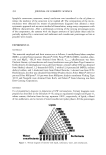
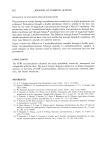
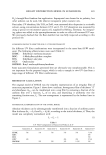
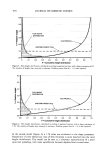
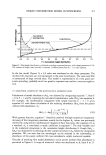
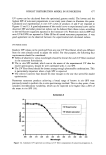
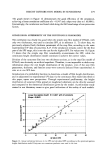
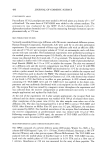
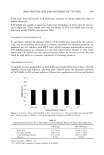
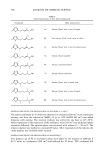
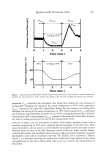
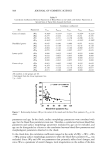
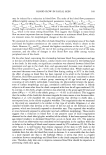
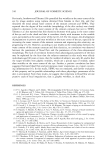
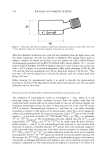
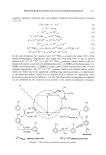
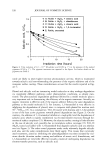
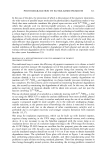
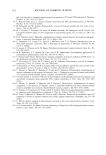
476 JOURNAL OF COSMETIC SCIENCE 1,6 • 1,4 g 4,2 '- 0,8 • 0,6 ,,-, 0,4 0,2 0 ß Experimental data ---Optimised Gamma function ß • , T 4 6 8 10 12 14 16 Absorbance of Parent uniform film Figure 10. Comparison between experimental data from sunscreen products A-F and the final fit calculated through the optimized gamma function. The resulting film profile is shown in Figure 11. As expected, a strongly skewed distribution resulted from the adjusted film model, taking into account the expected film spreading consequences: sunscreen depletion in the upper regions of the roughened substrate, with a high probability of finding a very thin film, and sunscreen accumu- lation into the valleys, with a broad distribution of all possible film thicknesses. 5,0 4,5 4,0 e 3,0 • , ' ........... .FILM HEIGHT . ._/.._ .- 2,5 - .... ../ • ........ FILM PROFIL 13:: 2,0 ........ II 1,0 0,5 - 0,0 0 0,1 0,2 0,3 0,4 0,5 0,6 0,7 0,8 0,9 F = Cumulative height distribution Figure 11. Film height distribution, calculated from the optimized gamma function. The number of height class intervals is arbitrary. Probability density data is twice the normal value.

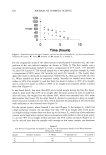
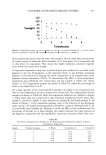
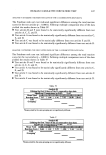
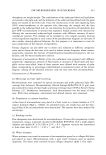
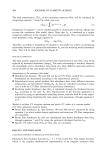
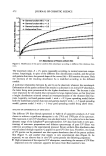
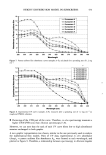
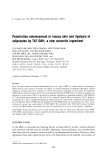
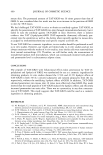
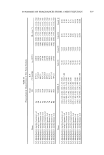
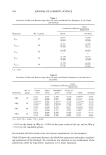
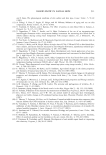
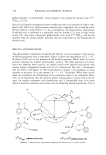
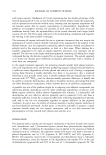
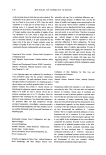
HEIGHT DISTRIBUTION MODEL IN SUNSCREENS 477 UV curves can be calculated from the optimized gamma model. The lowest and the highest SPF of sunscreen preparations in our study were chosen to illustrate this point. Calculated and experimental in vitro UV curves of products A and F are reported in Figures ! 2 and ! 3. A good adjustment of the model curve to experimental curve can be observed. SPF and other protection indices can be deduced from these curves, according to the well-known equations reported in the literature (! 5). Protection indices (SPF and ratio UVA/UVB) are reported in Table III for all tested sunscreen preparations. A very good agreement can be observed between the experimental and calculated indices. SPF PREDICTIONS Realistic SPF values can be predicted from any new UV filter blend, which are different from the ones already tested to adjust the model. For that purpose, the following four requirements should be considered: © Tables of absortivity versus wavelength should be known for each UV filter involved in the sunscreen formulation. © The in vitro SPF method, which was at the source of the experimental UV data for model optimization, should be well correlated with in vivo SPF. © The UV filter blend should be chosen among enough photostable combinations. This is particularly important when a high SPF is expected. © The selected cosmetic base should be close enough to the one that served for model optimization. Numerous sunscreen products achieving a broad range of known in vivo SPF were previously tested to perform the in vitro spectroscopy method. This is a key point, if one considers interlaboratory variability, which can be expected to be higher than +20% of the mean in vivo SPF (16). Sunscreen A 1,6 ........................................................ I 1,2 • 0,8 • 0.6 0,4. 0,2 ............................................... 0 ,,, , ...... , , 290 300 310 320 330 340 350 360 370 380 390 400 Wavelength Figure 12. Calculated UV spectrum according to UV filter composition of sunscreen preparation
Purchased for the exclusive use of nofirst nolast (unknown)
From: SCC Media Library & Resource Center (library.scconline.org)