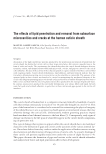
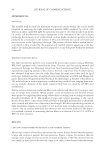
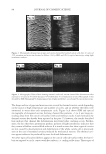
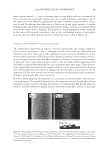
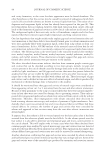
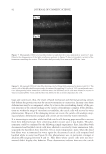
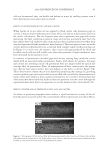
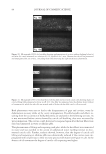
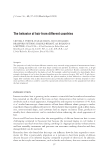
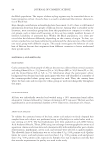
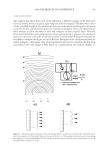
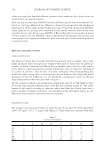
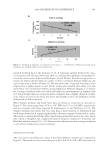
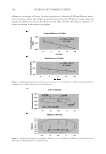
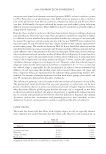
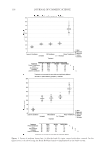
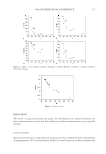
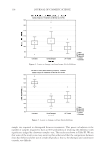
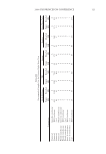
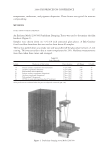
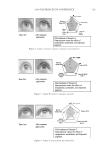
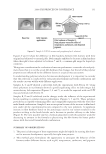
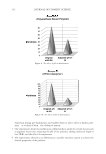
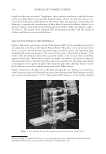
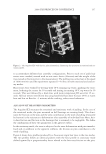
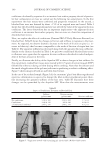
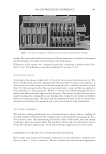
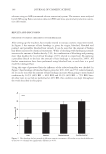
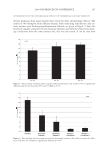
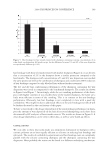
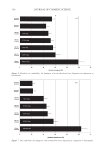
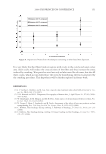
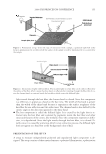
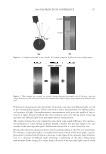
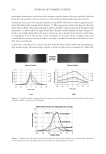
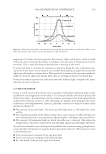
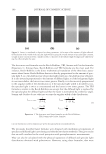
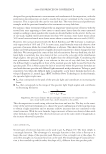
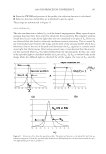
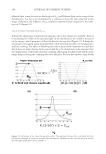
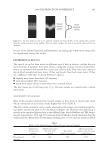
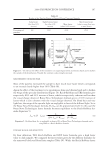
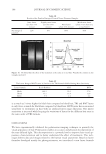
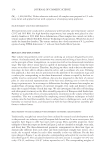
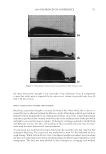
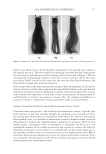
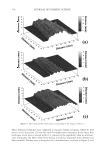
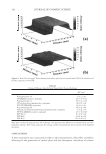
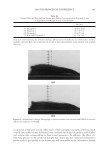
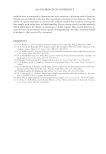
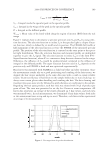
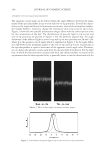
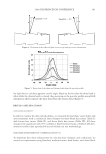
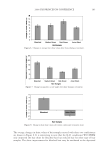
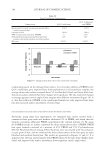
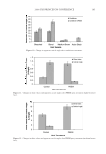
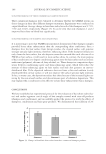
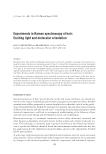
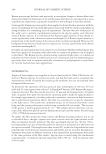
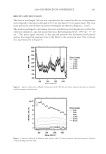
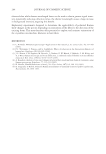
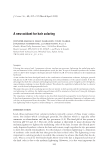
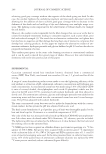
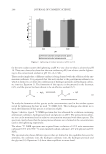
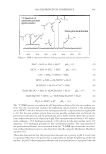
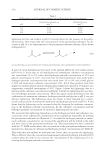
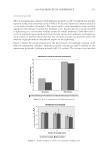
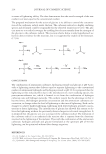
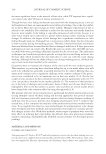
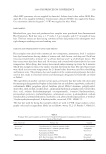
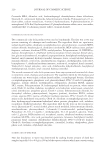
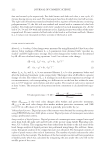
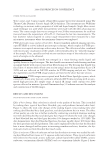
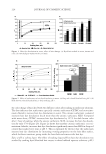
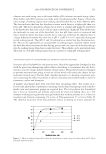
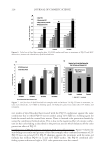
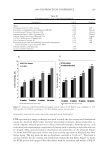
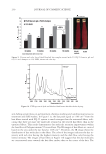
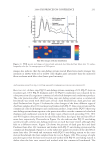
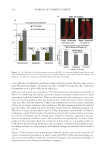
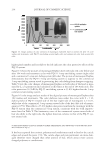
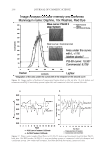
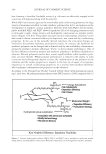
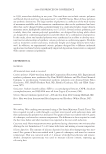
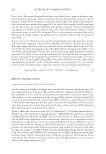
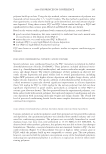
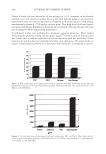
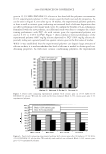
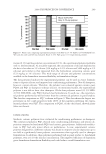
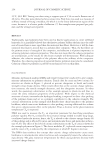
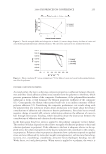
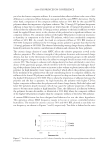
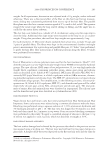
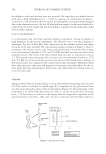
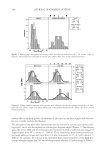
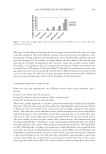
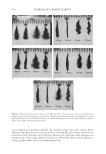
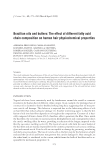
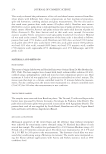
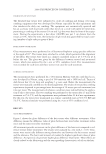
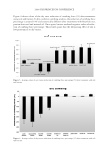
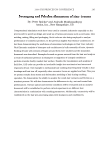
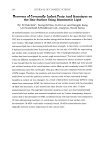
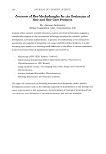
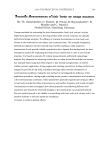
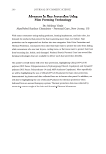
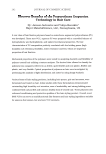
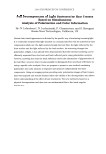
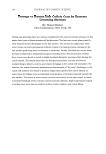
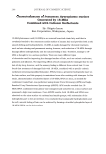
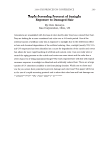
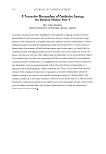
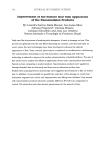
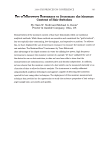
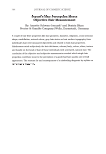
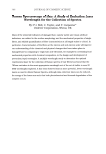
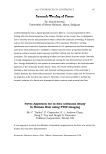
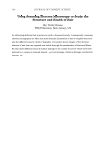
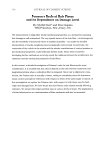
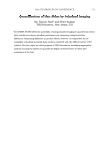
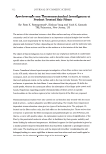
2008 TRI/PRINCETON CONFERENCE 201 RESULTS AND DISCUSSION The laser of wavelength 780 nm was considered as the control for this set of experiments and compared to the spectra obtained at 633 nm (red laser) 514 nm (green laser). The time series spectra for each of three excitation wavelengths are shown in Figures 1, 2 and 3. The analysis performed to determine the most suitable laser wavelength selected for data collection examined a spectral region that has a fl at background level: 1550 cm−1 +/− 10 cm−1. The mean signal intensity at this spectral position was determined and plotted against the integrated exposure time of the fi bers to the excitation laser. This is shown on a log-linear plot in Figure 4. Figure 1. Spectra collected at different time points with 780-nm excitation. Spectra decrease in intensity with increasing excitation time. Figure 2. Spectra collected at different time points with 633-nm excitation. Spectral intensity decreases with increasing exposure time.

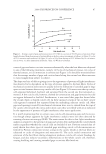
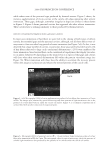
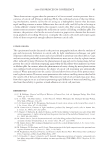
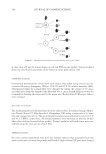
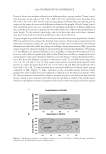
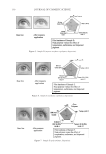
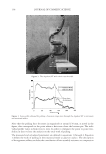
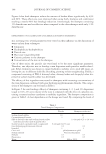
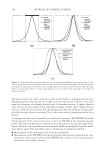
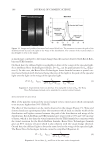
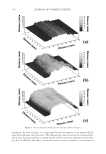
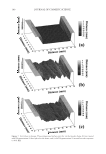
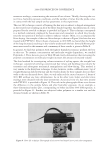
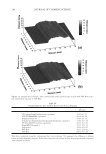
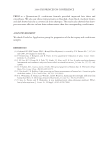
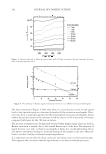
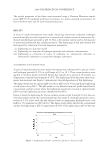
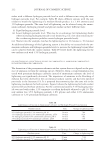
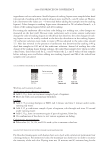
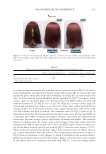
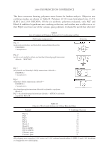
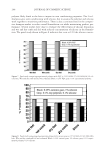
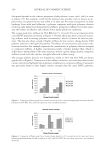
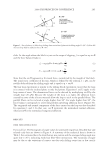
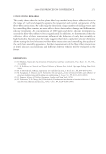
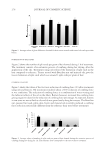
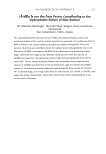
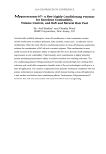
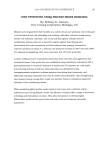
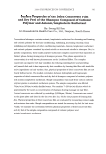
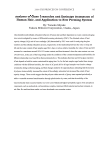
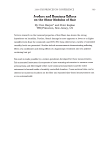
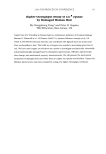
JOURNAL OF COSMETIC SCIENCE 202 The data contained in Figure 4 show that there is a clear decrease in the overall signal level in this spectral region as a function of time for all the excitation wavelengths. How- ever, this decay is especially apparent for the red and green excitation wavelengths, which exhibit decay times (time for the intensity to fall by a factor of 10) of the order of minutes compared with hours for the 780-nm excitation. The increase in luminescence background observed when higher energy lasers are used in Raman excitation is mainly due to the natural fl uorescence of the hair. The majority of signal decrease over time at shorter wavelengths is likely due to photobleaching effects and photon adsorption leading to localized heating of the sample at the area where the bean is incident, leading to thermal sample degradation. It is important to note that the decay curves are non-linear, oven on this log-linear plot. This supports the conclusion that the signal decay occurs due to multiple processes. Figure 3. Spectra collected at different time points with 514-nm excitation. Spectral intensity decreases with increasing exposure time. Figure 4. Plot of decay in Raman signal intensity (at 1550 cm−1) at different excitation wavelengths.
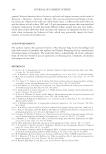
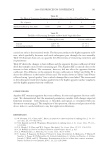
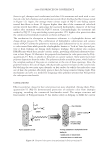
Purchased for the exclusive use of nofirst nolast (unknown)
From: SCC Media Library & Resource Center (library.scconline.org)