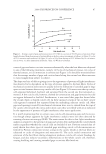
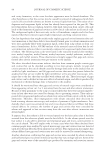
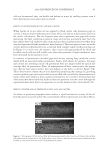
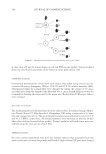
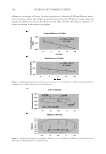
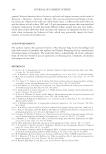
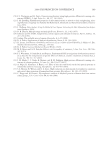
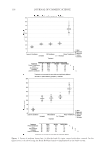
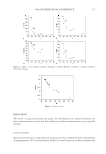
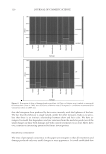
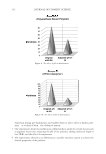
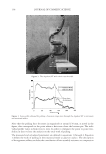
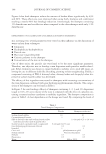
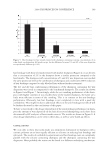
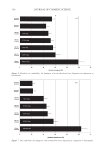
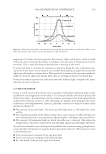
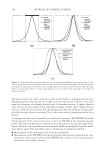
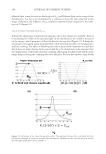
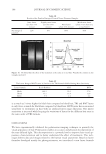
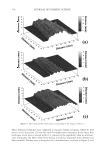
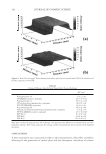
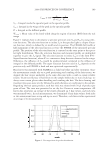
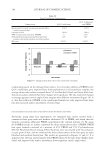
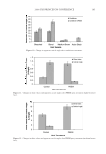
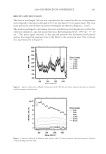
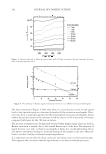
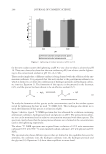
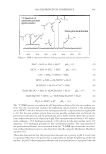
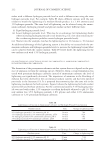
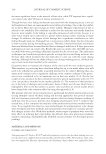
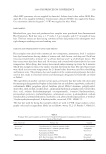
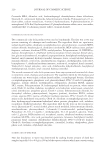
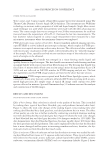
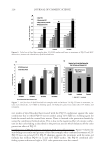
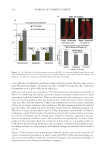
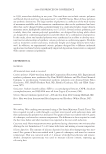
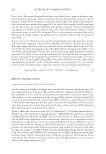
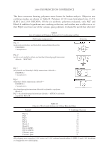
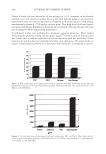
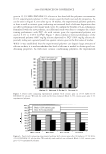
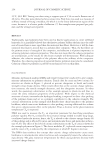
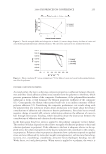
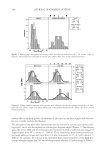
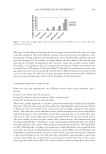
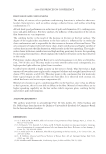
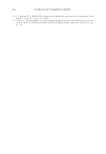
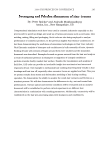
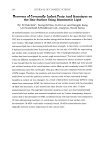
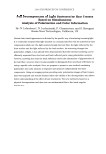
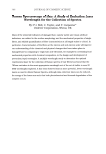
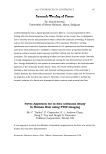
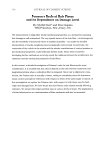
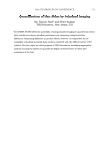
JOURNAL OF COSMETIC SCIENCE 118 sample size required to distinguish between treatments. This power calculation is the number of samples required to have an 80% probability of resolving the difference with signifi cance judged by a between-sample t-test. The results are shown in Table III. We see that some of the metrics are more sensitive than others and that the comparisons between clean hair before and after use of a wash off product, that is, the shampoo and conditioner controls, are diffi cult. Figure 5. Luster vs damage, red hair, Reich-Robbins. Figure 4. Luster vs damage, medium brown, Reich-Robbins.

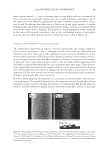
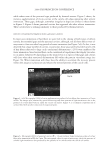
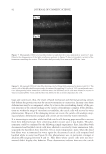
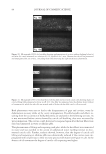
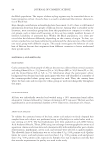
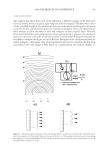
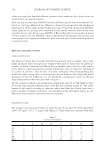
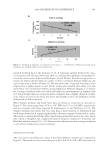
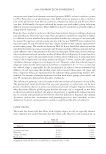
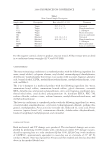
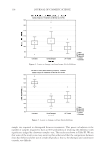
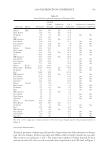
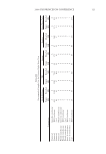
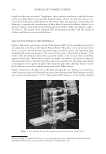
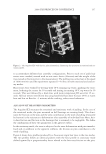
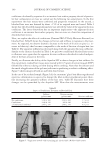
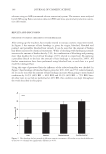
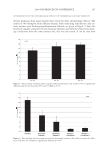
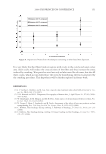
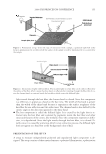
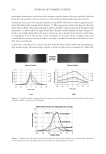
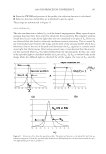
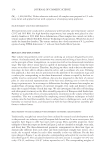
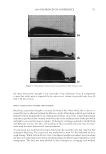
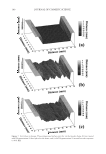
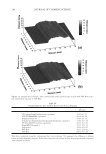
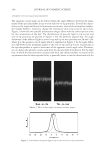
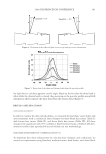
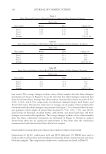
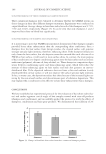
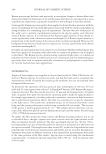
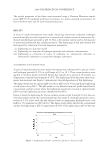
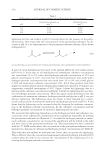
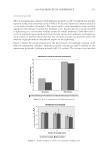
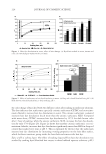
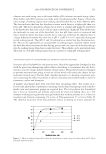
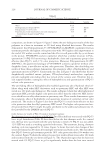
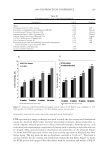
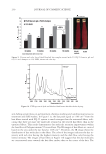
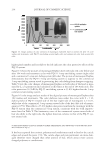
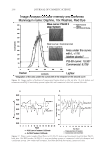
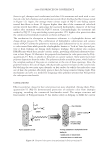
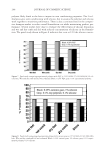
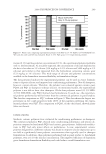
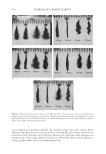
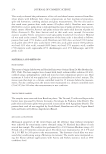
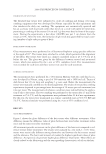
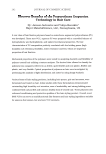
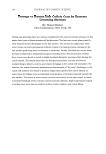
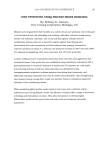
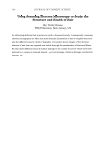
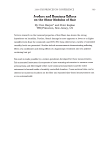
2008 TRI/PRINCETON CONFERENCE 119 LIGHTNESS DEPENDENCE Technical measures of shine typically produce larger values for dark substrates as absorp- tion tilts the balance between specular and diffuse refl ected light towards the specular. This trend is seen in Figures 3 and 4. The report that judgment of shine depends on skew and not on color (10), however, led us to make this comparison as well. We fi nd, in Figure 3, Table II Luster Results (polarized imaging) on Damaged Hair Hair type Metric Untreated 20000X Comb- damaged Combed vs untreated UV + conditioner Conditioned vs untreated Combed vs conditioned Indian TRI 30.4 30.5 No 33.4 Med. Brown 23.6 24.4 No 25.9 Piedmont 2.6 3.2 No 2.5 No No Red 27.2 24.4 27.2 MB bleached 10.4 11.3 No 10.4 No Dyed black 21.8 21.5 21.1 No No Dyed brown 12.4 12.8 No 7.8 No No Dyed red 14.6 15.0 No 7.9 No No Indian Stamm 93.2 92.3 92.4 No Med. brown 85.9 85.7 83.4 No No Piedmont 22.1 24.8 No 21.6 No No Red 86.5 84.9 84.1 No No MB bleached 64.3 65.8 No 66.6 Dyed black 84.6 83.7 76.7 No No Dyed brown 64.5 62.9 51.9 No No Dyed red 71.2 70.0 53.8 No No Indian Reich- Robbins 275.0 245.4 272.1 No Med. brown 103.4 105.4 No 96.6 No No Piedmont 2.1 2.7 No 2.0 No No Red 124.9 99.8 105.6 No MB bleached 17.9 20.4 No 19.2 No Dyed black 87.4 81.6 56.5 No No Dyed brown 21.6 21.4 10.0 No No Dyed red 31.6 31.0 10.6 No No Indian Guiolet 13.7 12.0 12.2 No Med. brown 6.1 6.0 5.0 No No Piedmont 0.3 0.3 No 0.3 No No Red 6.4 5.6 5.3 No No MB bleached 1.8 1.9 No 2.0 Dyed black 5.5 5.1 3.3 No No Dyed brown 1.8 1.7 1.1 No No Dyed red 2.5 2.3 1.2 No No Indian Boosa-Nova 46.9 38.8 53.3 Med. Brown 26.2 26.9 No 27.1 Piedmont 1.1 1.4 No 1.1 No No Red 32.5 24.4 30.5 No MB bleached 7.9 8.2 No 8.6 Dyed black 27.0 22.0 20.2 No No Dyed brown 9.6 8.3 6.1 No No Dyed red 14.2 11.1 6.2 No No The text in the comparison column indicates if the directional change matches the perceptual results in Figure 6.
Purchased for the exclusive use of nofirst nolast (unknown)
From: SCC Media Library & Resource Center (library.scconline.org)