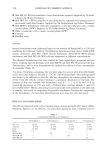
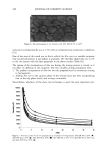
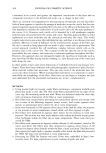
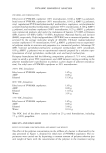
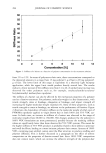
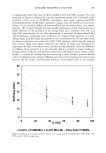
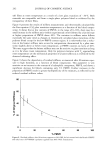
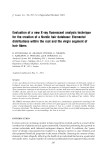
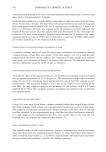
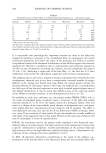
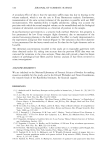
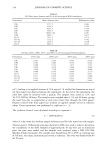
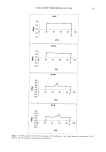
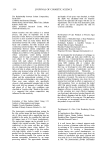
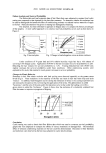
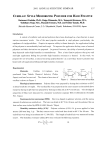
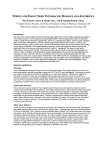
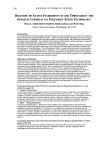
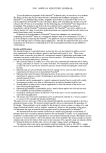
ELEMENTAL DISTRIBUTION IN HAIR 301 1000 10o 10 ß cJ K ß ½r ß ß Mn ee ee Cu Fe Ni Zn 0.1 I i i i i i i ! i i i i i , 0 2 4 6 8 10 12 14 Energy, keV Figure 2. Diagram of detection limits for different elements in hair. The lower sensitivity for light elements Z20 (Ca) is essentially related to the low energy of the fluorescent X-ray and consequent absorption of X-ray energies in the matrix and the air volume between sample and detector. Detection limits for other elements can be estimated from the graph, using their respective fluorescent X-ray line energies (cf. ref. 7 for description of the instrument). especially developed for microbeam analysis using the capillary technique. The program is of the fundamental parameter type and has been described earlier (20). HAIR PREPARATION AND ANALYSIS The material in this investigation was previously used in a PIXE study (9). The details of the sample collection criteria were given in that paper. In short, hair fibers were collected by plucking them from the temporal area 1.5-2 cm above the right ear of 63 normal, healthy, Caucasian individuals, who represented at least the third generation of Swedish citizens. A triplet of anagen hairs (in 20 cases six hair fibers) from each individual was selected for the study. In the present study an area close to the root was chosen in each hair fiber. This section was approximately 5 mm away from the part of the strand earlier analyzed using PIXE. One set of hairs of the double triplets had been cleaned prior to the earlier PIXE analysis. No further cleaning was done prior to analysis. However, as expected, it was found that particles on the hair fiber surface could affect the results. Therefore, the surface of the hairs were checked using the video cameras. Particles were removed using a fine brush. Hair fibers found to have extremely high values for some elements were cleaned in chloroform:methanol (1:1) for one minute with continuous stirring and were subse- quently reanalyzed. If values were then considered within the normal range, no further step was taken to control the cleanliness of the fiber. Furthermore, for each element, fibers giving extremely high concentration values were reanalyzed after cleaning. If the

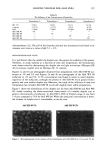
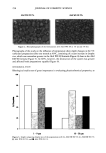
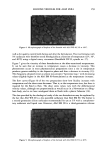
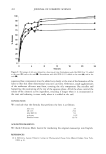
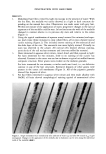
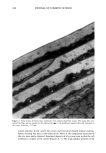
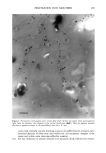
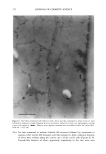
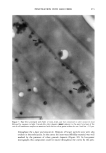
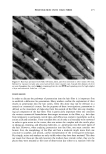
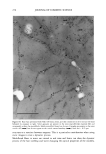
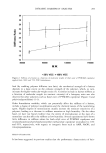
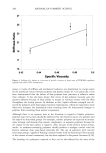
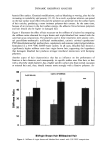
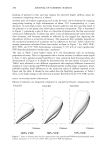
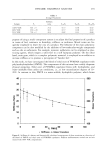
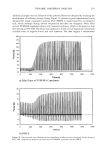
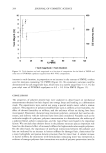
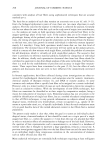
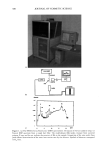
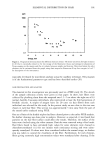
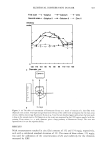
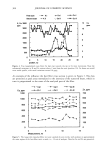
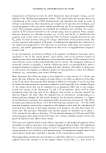
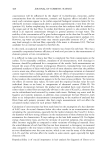
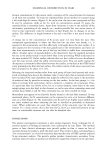
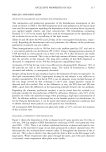
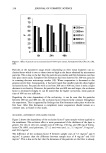
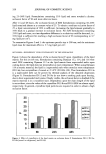
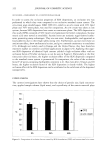
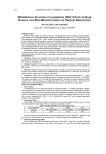
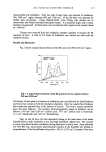
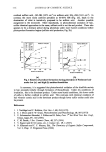
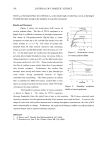
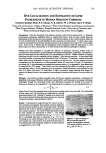
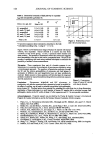
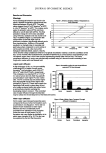
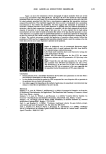
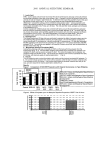
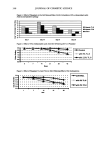
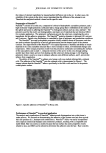
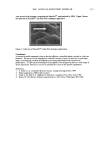
302 JOURNAL OF COSMETIC SCIENCE concentration was found to be lower for some elements when reanalyzed, the latter data were used in the presentation of results. Each hair was mounted on a sample holder using adhesive tape, the point of fixture being about 10 mm from the root. The hair fibers were placed in the beam with the hair axis positioned approximately parallel with the X-ray beam axis, so that about 1.5 mm of the fiber, 2-3 mm from the root, was exposed to the X-ray beam and thus analyzed. The length of the hair section that was analyzed was also determined by the solid angle (for detection of X-rays) of the detector. Analysis was performed for 12 minutes (real time), operating the X-ray tube at 55 kV and 30 mA and at a count rate of 1000-3000 counts per second, depending on the mass of each hair section. CALIBRATION OF CONCENTRATIONS OF ELEMENTS IN HAIR In order to calibrate analytical data, Zn values were determined in a sample containing a larger amount of hair from one person. From this sample, two 0.5-g samples were analysed with neutron activation analysis. For comparison, 61 hair strands were analyzed twice each, with a distance of about 1 cm between the analyses. The obtained data were used for calibration using the NAA results as reference. MEASUREMENTS RELATED TO HAIR FIBER CROSS SECTION To study the effect of hair mass attenuation, one hair fiber was rotated around its length axis in angular increments of 22.5 ø (Figure 3). The cross section of the fiber as viewed along the axis of the impinging beam was recorded by one of the CCD cameras at each measurement. The registered diameter varied due to the elliptical cross section of the hair fiber. At each angle an analysis was performed of the volume within a 0.3-ram segment of the fiber. The complete sequence of analysis was repeated once to estimate the reproducibility. VARIATIONS ALONG HAIR FIBERS Using a 0.3-mm-wide X-ray beam, volumes contained within this length along the hair fiber were analyzed. Each volume was separated from the previous one in 0.2-mm steps. The variation of elemental concentrations along a portion of the fiber close to the root was thus recorded. In this experimental setup, the fiber was placed and moved vertically at a right angle to the impinging beam. The scan started close to the root and was repeated once to estimate the reproducibility (Figure 4). LONG-TERM REPRODUCIBILITY TESTS The reproducibility of the results given by this new technique has been tested using three hair fibers from the analyzed material (Figure 5). These hair fibers were analyzed twice a week for seven weeks (i.e., 14 times) in approximately the same region and under the given analytical conditions used for the database analyses.
Purchased for the exclusive use of nofirst nolast (unknown)
From: SCC Media Library & Resource Center (library.scconline.org)