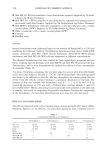
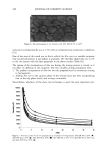
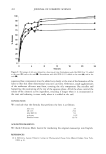
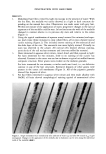
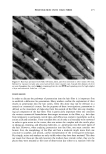
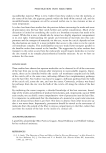
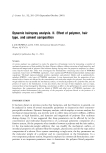
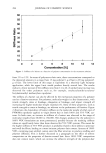
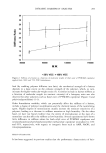
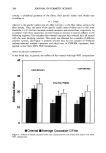
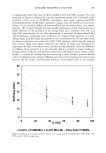
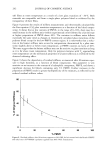
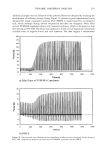
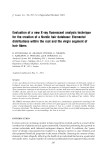
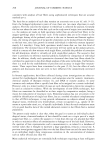
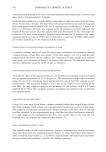
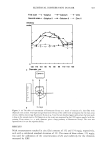
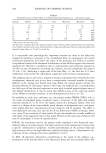
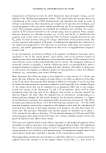
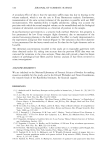
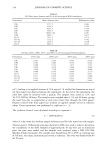
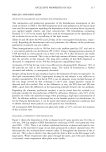
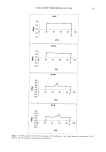
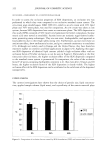
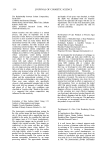
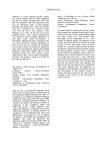
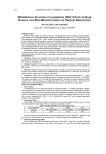
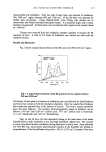
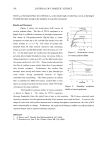
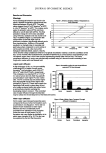
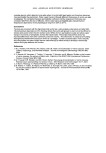
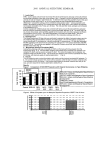
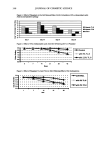
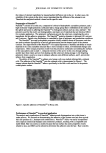
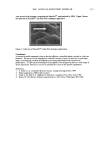
318 JOURNAL OF COSMETIC SCIENCE 80 70 60 50 40 30 20 10 0 ....... i:: '::: .:: :!: 6h 24h 48h :::. :::5 -:.r :-:- :.:..:.: ß 200nm [] 300nm ß 400nm ß 600nm :D 4000nm Figure 1. Effect of particle size on occlusion factor F (40% lipid content, formulations CPa, CPb, CPc, CPd, CPe). Particles in the nanometer range revealsdepending on their mean diameter--an oc- clusion factor which is two to three times as high as the factor obtained by micrometer particles. This is due to the fact that the particles are smaller and film formation can thus take place more easily. Complete film formation has been observed for 200-nm particles in scanning electron microscopy studies (19). Water evaporation is decreased to the greatest extent here. Consequently, it has been found that smaller particles show higher occlusion factors. For particles with a size from 200 nm to 400 nm, there is only a slight decrease in occlusivity. However, for particles that are 600 nm and larger, the occlusion factor is decreased strongly. It can be stated that for higher occlusivity, mean particle sizes of 400 nm are sufficient. Regarding the time dependency of the occlusivity, it can be seen that for particles between 200 nm and 400 nm, the occlusion factor remains fairly constant throughout the experiment. This is supported by findings that film formation takes place within the first hour. After film formation is completed, water evaporation should remain at a constant rate, as found in this study. OCCLUSION--DEPENDENCY UPON SAMPLE VOLUME Figure 2 shows the dependency of the occlusion factor F upon sample volume applied to the membrane. The occlusive effect is more pronounced if the thickness of the layer is greater. For this invitro test, sample sizes of 100 mg, 150 mg, and 200 mg of formu- lation CPa (40% cetyl palmitate, 227+2 nm) were used, i.e., 5.3 mg/cm 2, 8 mg/cm 2, and 10.6 mg/cm 2. The difference of the occlusion factor F between sample sizes of 5.3 mg/cm 2 and 8 mg/cm 2 is greater than the difference between sample sizes of 8 mg/cm 2 and 10.6 mg/cm 2. This is due to the fact that the denseness of the particles on the filter is already

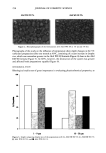
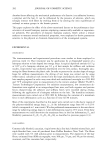
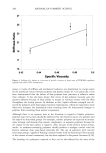
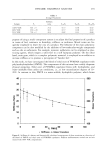
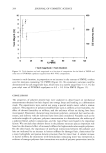
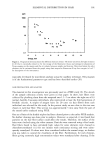
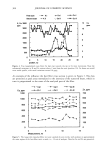
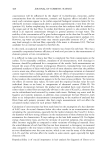
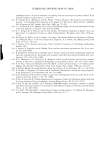
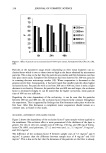
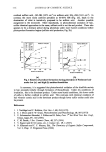
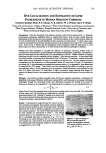
OCCLUSIVE PROPERTIES OF SLN 319 80 70 60 50 40 30 20 10 0 6h 24h 48h 100mg [] 150mg ß 200mg Figure 2. Effect of applied sample volume on occlusion factor F (40% lipid content, formulation CPa). relatively high at higher sample masses. A critical value has to be reached in order to enable film formation from particle fusion. Even for this highly concentrated SLN dispersion, a sample size of 5.3 mg/cm 2 is not sufficient to fully cover the filter paper with lipid particles and to obtain a pronounced occlusivity factor. A minimum of 8 mg/cm 2 is required, corresponding to 3.2 mg of lipid per cm 2. A sample size of 10.6 mg/cm 2 yields a factor F above 60, approaching the value of highly occlusive (but simultaneously very glossy) petrolatum. OCCLUSION--DEPENDENCY UPON LIPID CONCENTRATION Figure 3 shows the correlation of occlusion factor F and lipid concentration. For these in vitro tests, the SLN formulation CPa was used. For lower lipid concentrations, this formulation was diluted with distilled water. After six hours, a low occlusive effect was seen for formulations containing up to 20% lipid. A fairly low occlusive effect of 20-25 could be detected for formulations contain- Figure 3. Effect of lipid concentration on occlusion factor F (sample volume: 200 rag formulation CPa).
Purchased for the exclusive use of nofirst nolast (unknown)
From: SCC Media Library & Resource Center (library.scconline.org)