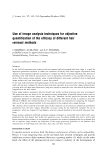
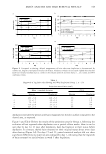
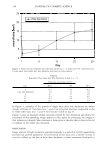
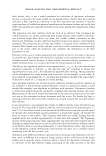
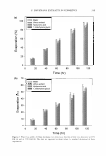
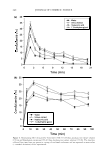
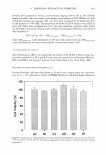
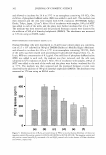
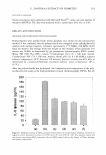
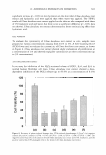
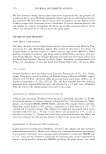
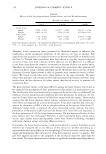
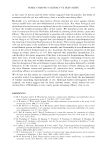
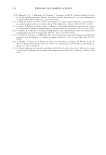
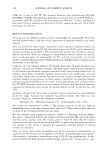
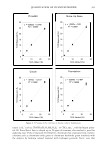
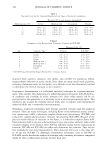
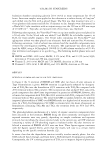
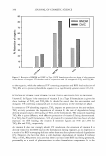
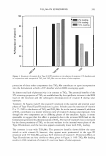
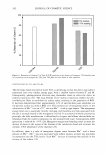
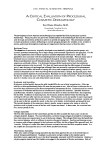
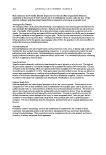
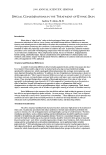
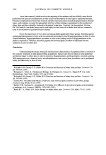
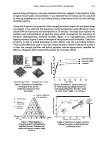
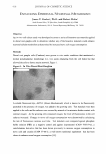
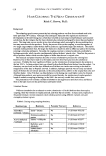
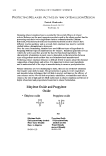
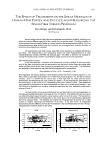
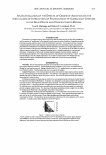
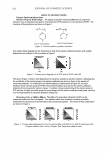
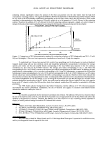
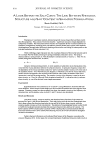
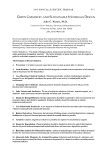
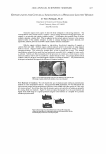
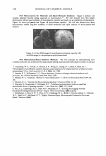
IMAGE ANALYSIS AND HAIR REMOVAL EFFICACY 349 a b 80 250 !!! 60 '1S 40 20 --+-Shaving I --------waxdepilalion1 .� ---- "' � �· '" "\ ___ , ------1· --·- I 200 (,:i 150 100 50 10 10 Day Day d 2500 25 --+-Shaving � 20 ! 2000 --------wax depilation ., g 15 1500 ! 'S 1000 'S 10 --+-Shaving --a-Wax depilation 500 ...J 0 10 1 10 Day Day Figure 2. Compared to shaving, delayed reappearance of hairs after wax depilation is demonstrated by number (a), length (c) and projection area (d) of hairs. Thickness of hairs (6) increased slightly directly after both hair removal methods due to a shift in the relation of thick and thin hairs n = 10, means and 95 % confidence limits. Day 2 4 7 9 Table I Regrowth of Leg Hairs after Shaving and Wax Depilation (Group 1, n = 10) Projection area of hairs (mm2) Mean ± standard deviation CI% Shaving Depilation Shaving 13.2 ± 5.0 11.0 ± 3.6 3.6 5.2 ± 1.7 3.0 ± 1.4 1.2 7.6 ± 2.9 4.2 ± 4.8 2.1 11.4 ± 3.0 3.7 ± 1.1 2.2 14.7 ± 5.3 5.5 ± 3.0 3.8 Depilation 2.6 1.0 3.4 0.8 2.2 depilation extended the period until hairs reappeared on the skin surface compared to the shaved area, as expected. Figure 3 and Table II show the results of the projection area for Group 2, following the evolution of hair regrowth after depilation over a period of four weeks. Here it can be seen that by day 22, 21 days after depilation, hairs had regrown to their status before depilation. In contrast, shaved hairs returned to their original status about seven days after shaving (Figure 2d). For days 15 and 22, paired statistical analysis did not show significant differences in projection area compared to day 1, indicating that the regrowth of hairs returned to initial values in week 3 after depilation.

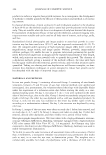
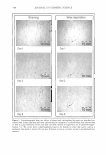
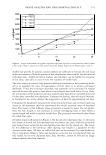
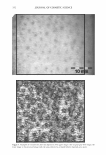
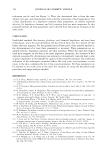
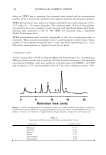
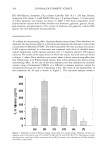
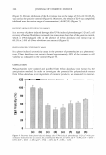
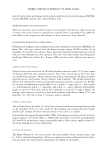
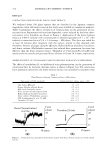
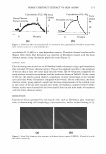
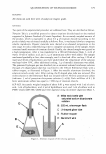
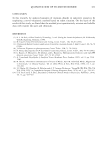
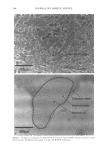
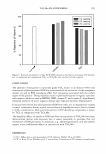
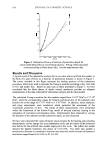
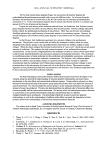
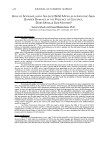
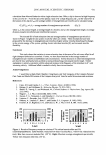
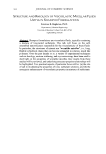
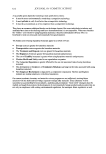
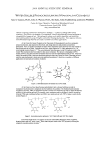
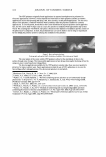
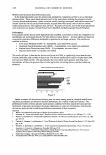
350 N"' E E en 1- "iij .c 11- 0 "' Cl) 1- 25 20 15 10 5 0 1 JOURNAL OF COSMETIC SCIENCE 1----wax depilation I 8 15 Day 22 29 Figure 3. Projection area of regrown hairs after wax depilation n = 9, means and 95% confidence limits. It takes about three weeks after wax depilation until hairs are fully regrown. Table II Regrowth of Leg Hairs after Wax Depilation (Group 2, n = 9) Projection area of hairs (mm2) Day Mean SD CI% 12.2 5.4 4.2 1 day after depilation 2.4 1.3 1.0 8 4.1 3.7 2.8 15 9.9 6.3 4.8 22 14.2 6.8 5.2 29 15.9 7.7 5.9 In Figure 4, examples of the growth of single hairs after wax depilation are shown (results of Group 2). Two hairs (nos. 1 and 2) are presented that have reappeared at day 8, while other hairs (nos. 3 and 4) first become visible at day 15. Figure 5 gives an example of skin irritation evoked by hair depilation and shows the possibility of also extending image analysis to this aspect by processing the images so that redness is evaluated. Skin irritation is then given as the area that is detected as red in relation to the whole area measured. DISCUSSION Image analysis of high-resolution macrophotographs is a powerful tool for quantifying relevant hair growth parameters. Good retrieval of test areas over a month or more is crucial to follow up the fate of hairs after depilation or after treatments developed to
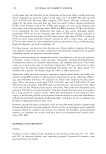
Purchased for the exclusive use of nofirst nolast (unknown)
From: SCC Media Library & Resource Center (library.scconline.org)