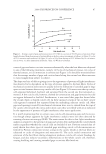
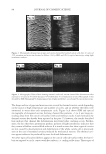
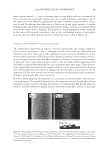
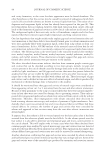
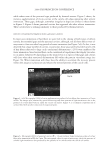
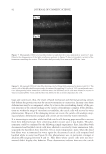
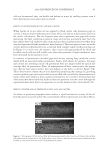
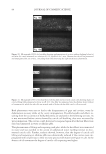
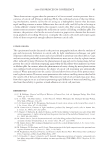
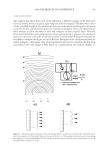
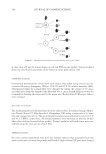
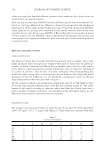
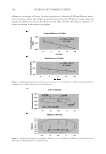
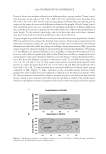
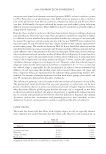
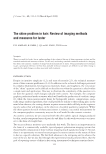
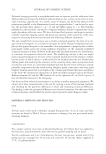
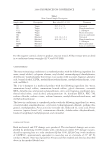
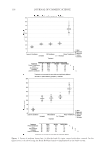
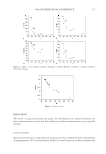
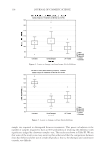
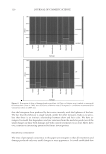
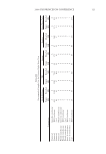
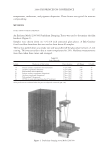
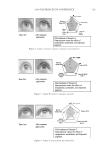
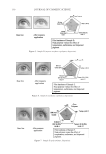
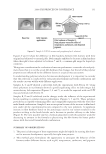
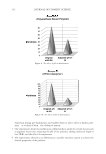
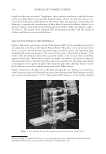
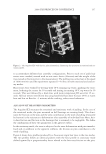
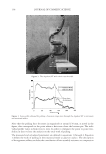
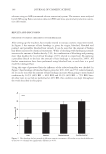
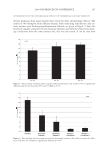
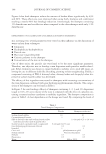
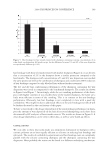
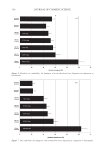
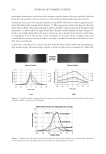
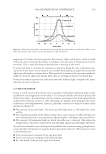
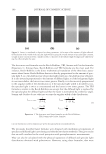
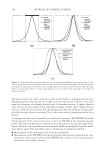
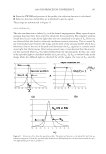
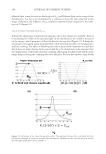
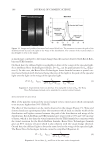
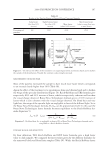
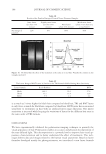
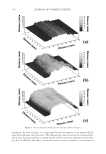
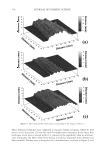
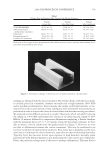
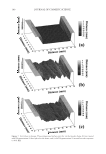
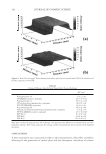
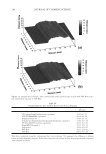
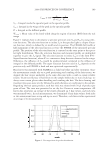
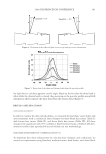
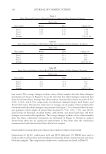
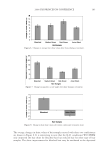
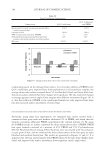
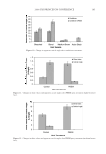
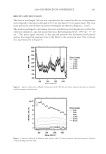
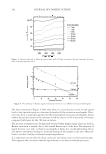
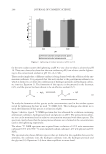
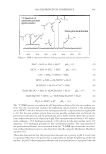
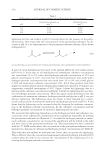
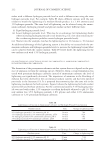
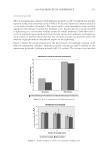
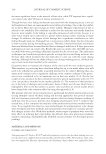
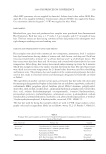
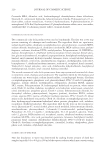
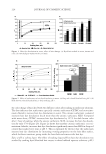
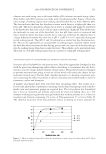
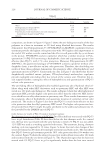
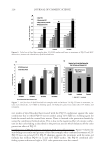
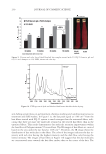
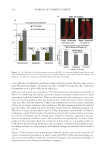
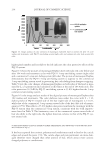
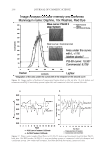
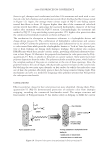
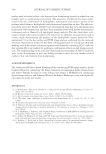
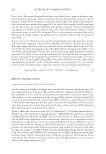
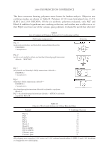
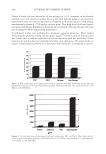
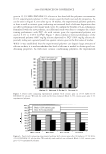
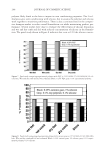
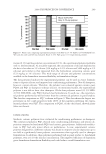
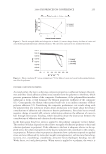
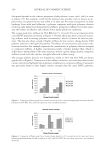
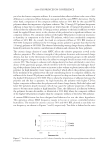
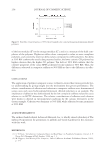
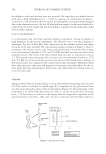
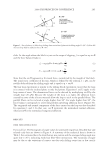
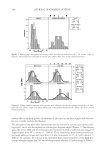
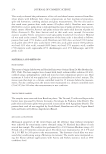
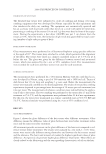
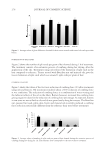
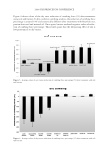
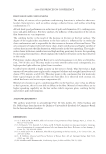
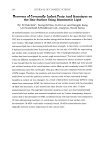
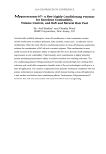
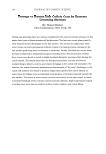
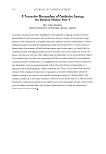
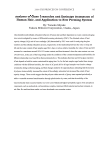
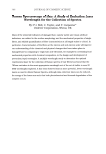
2008 TRI/PRINCETON CONFERENCE 103 reported for black hair in the literature (7–9). A regression analysis between the cross- sectional area and curl type shows that there is a statistically signifi cant relationship be- tween the cross section of hair and the degree of curl. Thicker hair fi bers tend to have a looser curl whereas thinner fi bers are curlier. A direct correlation between ellipticity and curl classifi cation is shown in Figure 3b. The data shows that, in general, hair that is more elliptical has a higher degree in curl. Earlier studies also revealed inter-ethnic (10) and intra-ethnic (11) correlations between curl and ellipticity. However, Nagase et al. did not see a strong correlation with curl radius and ellipticity measurements in Japanese hair (12). Even though there are exceptions where straighter hair is highly elliptical or ellip- ticity values can vary on one head, this linear relationship seems to be prominent in hair from people of African descent. Mean Young’s modulus and break stress data are shown as a function of curl type in Figure 4. The values range from 2670 to 3147 MPa and 173 to 206 MPa, respectively, and are consistent with those reported by Franbourg et al. and Wolfram (13,14). The Young’s modulus data shows that less curly hair is more resistant to deformation and break stress shows that it requires higher loads to fracture compared to hair that is curlier. This trend is common knowledge when considering populations based on race since Asian hair, which is straighter, has a higher mechanical integrity compared to Caucasian and Black hair which is curlier (10,13–15). However, this is the fi rst time that a strong correlation is seen in hair samples from one racial group. INFLUENCE OF COUNTRY The cross section and ellipticity values of hair from different countries are compared in Figure 5. The trends in cross section decrease as JA AA LI GA KE and statistical Figure 3. Geometrical properties as a function of curl class n = 12,050 fi bers. (a) Mean x-sectional area ± standard error. (b) Mean ellipticity ± standard error.

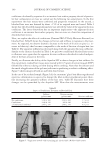
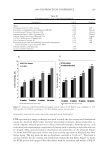
JOURNAL OF COSMETIC SCIENCE 104 differences are shown in Figure 5a where signifi cance is based on LSD and Duncan meth- ods of analyses where the output gives the same divisions. Ellipticity values show no signifi cant differences across all ethnicities for LSD, Scheffe and Duncan analyses. P- values are shown in the respective graphs. Figure 4. Mechanical properties as a function of curl class n = 12,050 fi bers. (a) Mean Young’s modulus ± standard error. (b) Mean break stress ± standard error. Figure 5. Geometrical properties according to ethnicity n = 12,050 fi bers. (a) Mean x-sectional area ± stan- dard error. (b) Mean ellipticity ± standard error.
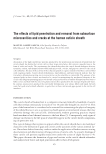
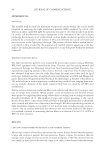
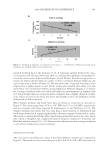
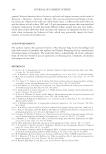
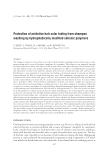
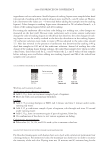
Purchased for the exclusive use of nofirst nolast (unknown)
From: SCC Media Library & Resource Center (library.scconline.org)