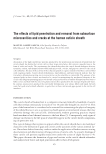
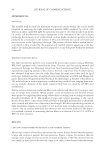
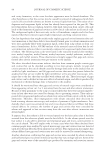
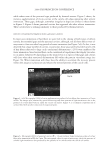
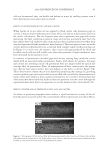
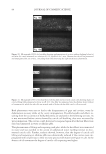
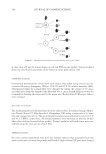
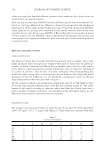
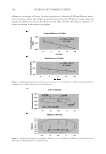
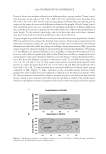
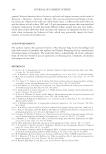
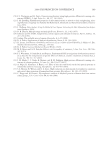
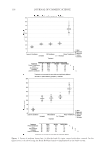
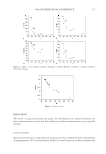
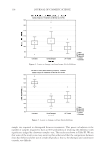
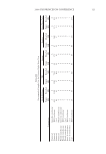
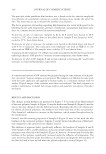
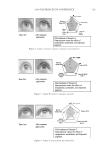
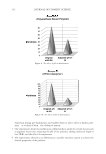
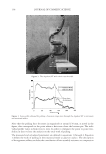
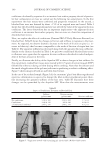
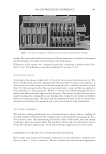
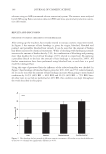
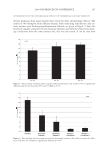
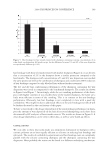
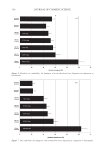
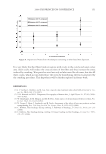
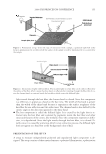
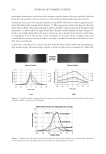
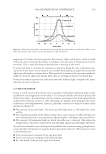
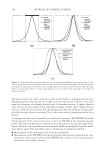
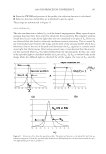
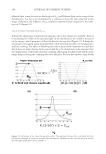
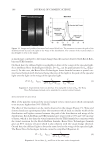
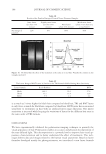
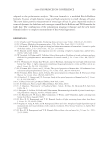
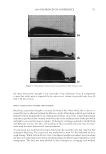
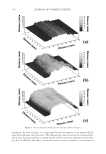
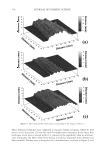
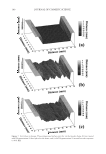
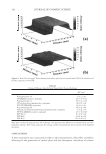
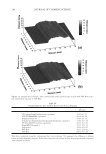
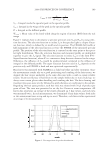
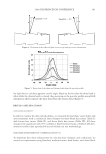
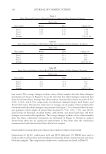
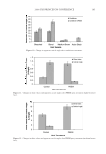
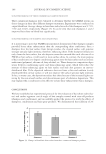
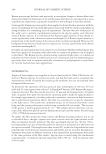
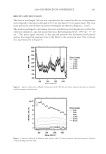
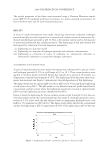
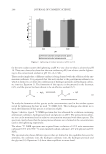
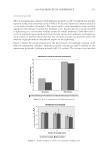
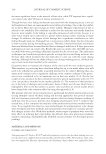
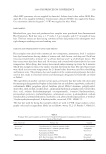
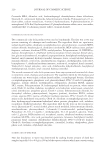
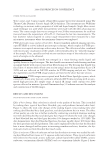
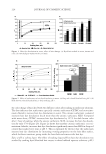
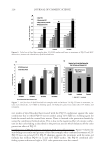
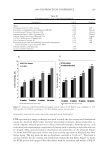
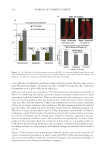
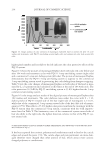
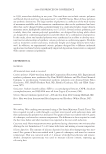
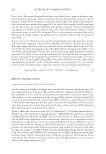
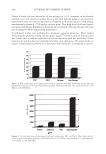
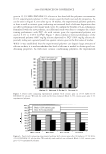
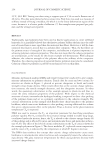
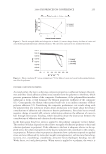
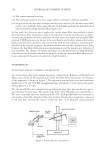
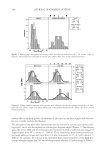
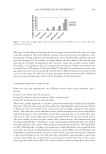
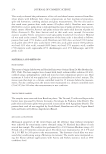
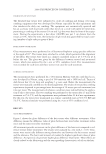
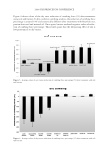
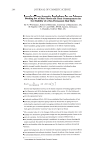
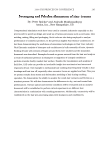
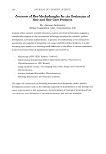
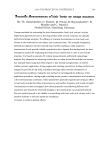
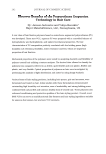
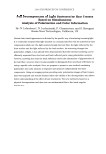
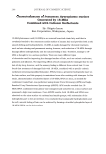
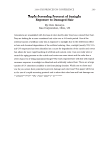
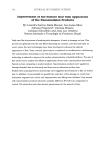
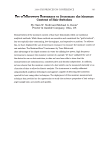
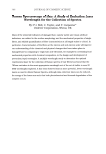
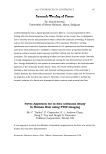
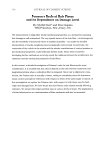
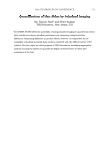
2008 TRI/PRINCETON CONFERENCE 105 Figure 6. Mechanical properties according to ethnicity n = 12,050 fi bers. (a) Mean Young’s modulus ± standard error. (b) Mean break stress ± standard error. Figure 6 shows the mechanical data for the different ethnic groups studied. Young’s mod- ulus decreases in the order of AA JA KE LI GA and break stress decreases from AA JA LI GA KE. For the statistical groupings, LSD and Duncan methods give an output of the same divisions with differences shown in the graphs. If both Young’s mod- ulus and break stress data are considered, the mechanical integrity of African-American hair is shown to be greater compared to the other ethnicities whereas hair from Kenya is more fragile. To the authors’ knowledge, this is the fi rst time that such ethnic compari- sons have been made and statistical differences have been observed. To gain insight on possible differences in the structure of hair from the populations studied, DSC was performed to evaluate the thermal characteristics. Denaturation temperature (Td) values give information about the cross-link density of the matrix in which the intermediate fi laments are imbedded while the change in enthalpy during denaturation (ΔHd) gives the energy required to denature α-helical content within the intermediate fi laments. Wortmann et al. and Marsh et al. reported differences in Td and ΔHd as a function of treatment (30,31) however, values did not signifi cantly differ when Wortmann and Deutz compared the ther- mal properties of hair from people of different races (20). Figure 7 shows the thermal behav- ior of hair from the different countries in the present study. Td and ΔHd values range from 151.7 to 153.1°C and 17.2 to 19.1 J/g, respectively, and are consistent with reported values (20,21). Td values decreased from AA LI GA KE JA and ΔHd decreased from AA GA KE LI JA. Td values showed more statistical differences between ethnic groups compared to ΔHd (Figure 7). Thus, variations in the cross-link density between ethnic groups were more readily detected compared to differences in the α-helical content. Over- all, African-American hair had the highest thermal integrity and Jamaican hair had the lowest, which is not consistent with data from the mechanical studies. One might expect that hair with higher mechanical integrity would also be more structurally robust in regards

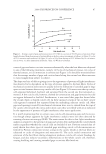
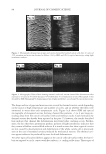
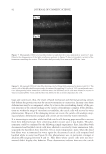
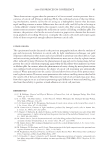
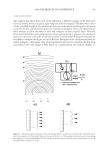
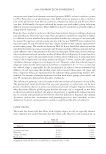
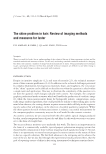
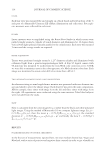
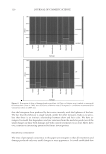
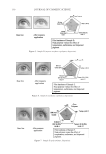
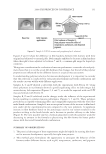
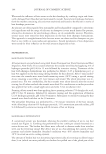
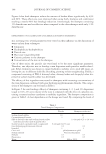
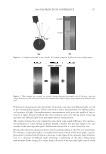
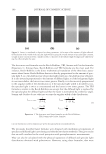
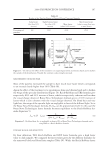
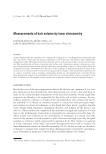
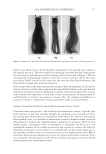
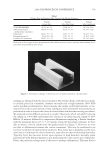
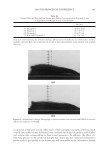
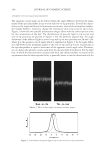
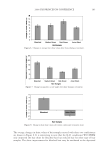
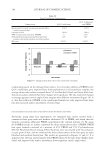
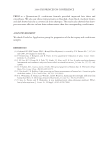
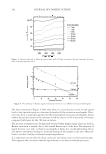
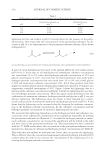
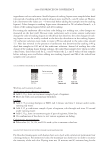
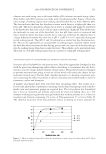
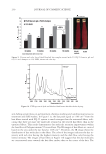
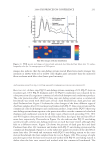
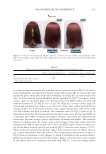
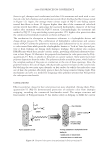
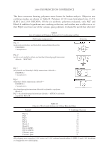
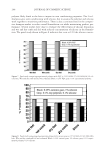
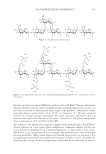
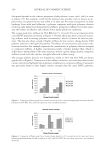
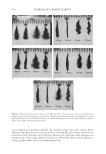
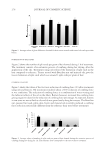
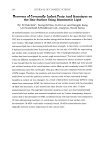
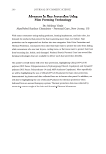
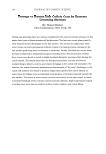
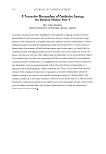
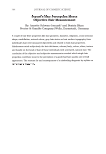
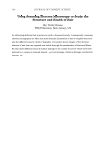
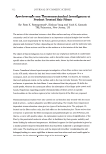
JOURNAL OF COSMETIC SCIENCE 106 to its matrix cross-link density and α-helical content. In fact, this is what is observed with African-American hair however, Jamaican hair, which had the second highest mechanical integrity, has the lowest thermal values. Additional studies are needed to assess chemical and structural differences that may be responsible for these results. Protein variations as a function of ethnic group were explored using 2D-gel electrophoresis and the results are shown in Figure 8. In all cases, minor variations in staining intensity occur when the IF proteins have MWs between 50–75 kDa. Similar results were reported by Nagai et al. and Khawar et al. (32,33) and Nappe and Kermici (34). In our study, most Figure 7. Thermal properties according to ethnicity n = 5 hair samples / ethnic group. (a) Mean denatur- ation temperature ± standard error. (b) The mean change in denaturation enthalpy ± standard error. Figure 8. 2-D gel electrophoresis of hair from different countries n = approximately four fi bers from 23–25 subjects / ethnic group. The presence and the intensity of spots give insight about specifi c proteins.
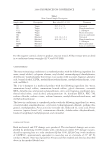
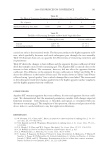
Purchased for the exclusive use of nofirst nolast (unknown)
From: SCC Media Library & Resource Center (library.scconline.org)