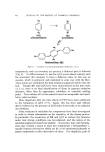
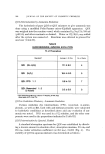
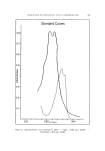
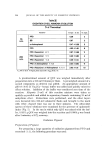
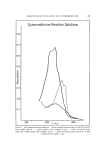
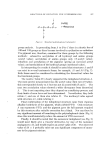
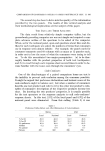
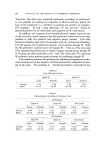
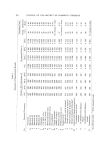
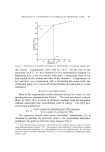
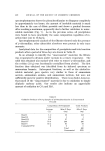
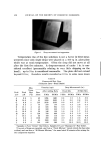
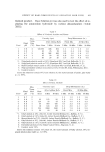
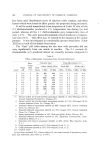
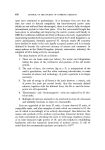
COMPARISON OF CONSUMER PANELS IN PAIRED PREFERENCE TEST. I[ 383 The second step has been to delve into the quality of the information provided by the two panels. The results of this vertical analysis and their methodological implications are the subject of this paper. THE DATA AND THEIR ANALYSES The data result from relatively simple computer tallies, but the groundwork preceding computer use was not simple and required a com- plete advance outline of the questions to be asked of the computer. When, as for the national panel, open-end questions about likes and dis- likes for each toothpaste are asked, the numbers of terms that consumers use in response seem almost infinite. For example, the punch cards for consumer comments used 69 columns with as many as 12 punches each, in order not to lose the sense of what the consumers were trying to tell us. To do this necessitated two major prerequisites: (a) to be thor- oughly familiar with the product properties of both test toothpastes and (b) to read through each response sheet several times in order to be- come familiar with the issues seen through the consumers' eyes. Code-Confusers One of the disadvantages of a paired comparison home-use test is the inability to prevent code-confusion among the consumer panelists. It might be argued that preference declarations and hedonic scores of the code-confusers ought to balance out but when a number of consumers describe one test product and refer to it by the other test product's code, tallies of consumers' descriptions of the respective products become less clear. By knowing the two products' properties, it is usually possible for the test operators or the response analysts to cull code-confusers' response sheets. In this test, 2.5% of the local panel and 8.3% of the national panel were eliminated. From this culling (Table I) it was Table I Preference Tallies Before and After Elimination of Code-Confusers Before After Local National Local National % for R 52.6 45.9 54.0 48.8 % for W 27.3 29.7 25.2 25.3 No preference 16.9 19.4 17.5 20.5 Neither 3.2 4.4 3.3 4.9 No answer . .. 0.6 ... 0.7 Persons 403 832 388 763

$8•t JOURNAL OF THE SOCIETY OF COSMETIC CHEMISTS learned that: (a) the local panel produced fewer code-confusers (either because the local panel was a "better" panel or because their alternate, rather than weekly, use of the toothpastes sharpened their memories of the products) and (b) most of the code-confusers had voted for Toothpaste W instead of Toothpaste R, which they had de- scribed as W. This meant, not that the code-confusers balanced out, but rather that the preference percentages increased slightly for Tooth- paste R and decreased slightly for Toothpaste W. Role of Consu•ers Who Do A ot Cast a Preference Vote Also observed in Table I is the increase in percentages of panelists who had no preference, who preferred neither, and who failed to respond to the preference question. In the last column, such persons in the na- tional panel who did not cast a preference vote were more numerous than those who voted in favor of Toothpaste W i.e., 25.3% voted for W and 26.1% did not vote for either of the test products. The nonvoters in a paired preference test pose several questions: Did they really have no preference? Didn't they really test the prod- ucts? Did they refuse to commit themselves ? Who are these people? What level of nonvoters is negligible and at what level do they become important in interpreting the test findings? Why did 20% or more of these consumer testers have no preference: Consumer-test operators and users of consumer-test data must never forget these fundamental questions of methodology. If they do, the status of product testing through consumer panels will remain as it is now: an approach of unknown reliability for decision making. Of the nonvoters in this study, more children than adults declared no preference and children under six years of age were found to be mainly responsible for the children's relatively high no-preference percentage (2). Checking these nonvoters' response sheets showed that the children gave no information and the adults found no difference between the toothpastes. A slightly higher percentage of nonvoters was found in the national panel: 26.1% national 20.8% local. In fact, the percent- age of national nonvoters was a modicum higher than the national pre- ferrers of Toothpaste W (25.3%). Thus far, the local panel had fewer code-confusers and fewer non- voters. In other words, more persons (by per cent) in the local panel provided information. The remainder of this vertical analysis examines the quantity and quality of the information given by preference voters.
Purchased for the exclusive use of nofirst nolast (unknown)
From: SCC Media Library & Resource Center (library.scconline.org)