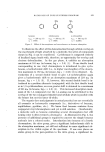
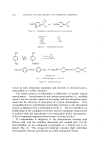
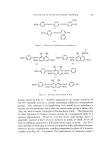
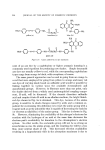
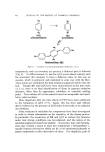
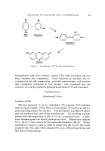
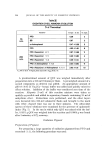
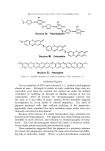
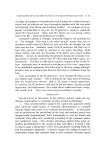
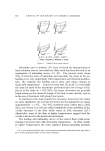
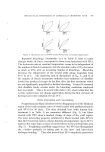
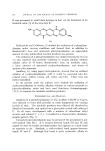
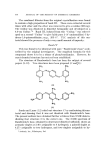
416 JOURNAL OF THE SOCIETY OF COSMETIC CHEMISTS The combined tiltrates from the original crystallization were found to contain a high proportion of band III. These were extracted several times with ether and the ether was removed to give a residue (900 mg). The residue was dissolved in dimethyl formamide and developed on a 4.0-cm Unibar. ©* Band III, isolated from this "Unibar," was redevel- oped on a second "Unibar" to give fairly pure 2-(4'-aminoanilino)-5-hy- droxy-l,4-quinonediimine m.p., 203-6 ø. TLC analysis of this ma- terial showed the presence of only a very small amount of impurity. Band IV This was found to be identical with pure "Bandrowski's base" as de- scribed by the original investigators. The empirical formula for this compound shows it to be a trimer of phenylenediamine. However, its exact chemical structure has not yet been established. The structure of Bandrowksi's base has been the subject of several papers (9-12). Two structures have been proposed (C artdiD): NH•, NH•, NH•, NH•, (c) I H,,N N Sunde and Lauer (12) ruled out structure C by synthesizing this ma- terial and showing that it was not identical with Bandrowski's base. The present authors have obtained further evidence from NMR data in- dicating that structure D is the correct one. The NMR spectrum of Bandrowski's base, obtained in deuterated dimethyl sulfoxide, shows an aromatic singlet at 3.40r assignable to 8 hydrogens, a quinoid singlet at 4.27r assignable to two hydrogens, and two singlets assignable to hy- * Analteeh, Inc., Wilmington, Del.

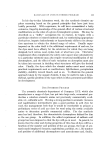
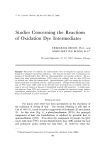
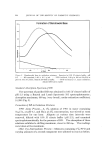
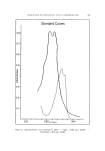
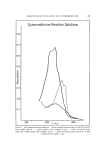
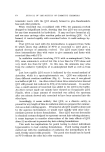
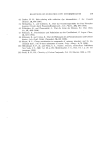
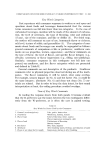
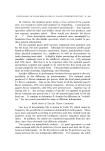
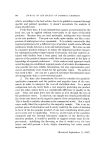
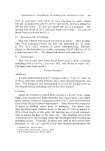
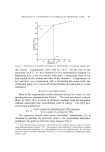
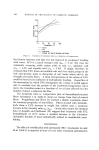
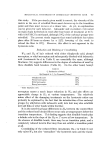
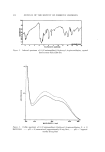
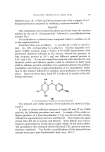
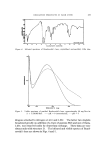
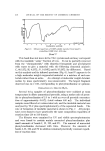
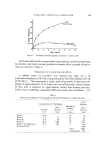
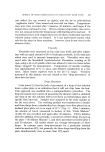
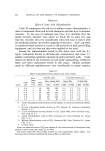
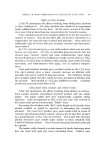
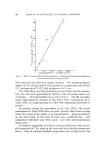
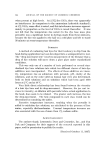
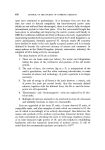
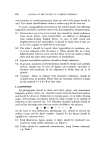
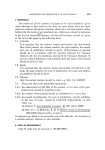
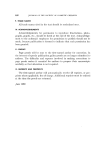
OXIDATION PRODUCTS IN HAIR DYES 417 ø.ø I .60 .70 1.0 INFRACOIID ,Jll• • 3 4 5 6 7 8 9 10 11 12 13 14 15 WAVELENGTH (MICRONS) Infrared spectrum of Bandrowski's base, crystallized acetone-H20, KBr disc Figure Figure I.O- a, 0,5- o drogens attached to nitrogen at 4.15 and 5.20r. The latter two singlets broadened greatly on addition of a trace of gaseous HC1 and one of them, 5.20r, was removed easily by deuterium exchange. These data are con- sistent only with structure D. The infrared and visible spectra of Band- rowski's base are shown in Figs. 4 and 5.
Purchased for the exclusive use of nofirst nolast (unknown)
From: SCC Media Library & Resource Center (library.scconline.org)