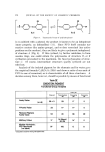
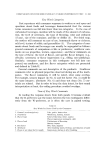
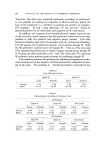
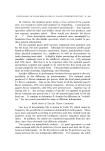
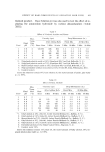
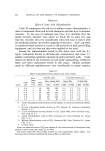
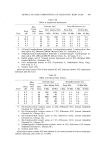
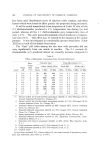
COMPARISON OF CONSUMER PANELS IN PAIRED PREFERENCE TEST. II 387 take the easy way out by isolating the negatives of W ? Or did they merely vote for R as the lesser of two evils ? What are the intensities of preference ? tIedonic Responses Most consumer test operators insert a value judgment question to measure the intensity of preference. This investigation used five- point hedonic scoring for both test products and for the consumers' usual brands of toothpaste. But test operators handle the hedonic scores differently. For example, Table III shows mean hedonic scores for both prod- ucts by all respondents in each panel. Analysis for sigma may not be the most appropriate analysis, but it does show the scatter around the mean scores, which is considerable. Actually, calculating over-all hedonic scores, like other over-all tallies, is a first look-see or horizontal analysis and probably is useful mainly in showing up inconsistencies in data. Table IV begins to unravel the problem of intensities of preference by scaling the two test products in relation to own brands. This table mainly shows that the preferred products rate as well as own brands and the nonpreferred products do not. In addition, it shows that the mean hedonic scores for the preferred samples are undoubtedly higher than those for the nonpreferred samples. But in the authors' opinion, a better way of examining hedonic data in order to view intensity of pref- erence is to compare how each voter rated each test product with how he rated his own brand--the product he usually buys. These comparisons are summarized in Table V. Two important points are dearly evident: (a) More W-preferrers scored W equally with or higher than their own brand than R-preferrers did for R and (b) the W-preferrers were not so hard on R as the R-preferrers were on W. The R-preferrers' hedonic responses about R were not unexpected, [or the major reason analysis had already shown that their preference was based on a negative reac- tion to W. But the relatively generous hedonic attitude of the W-pre- ferrers toward R has not thus far been exposed. In considering the findings from Table V, one must not ignore the staunch loyalty of the W-preferrers for Toothpaste W. If, for ex- ample, this had been a test of two new toothpastes, the question to de- cide might be: should we go with the toothpaste that most people said they preferred or with the one that was liked more intensely ?

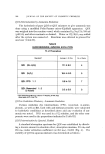
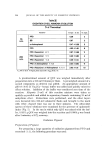
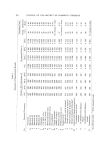
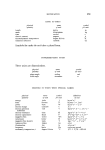
388 JOURNAL OF THE SOCIETY OF COSMETIC CHEMISTS Fortunately, that is not the question the authors set out to answer. What was required from examining the hedonic scores was if the local and national panels were divergent. From the three exercises tabulated for hedonic data, it is concluded that the panels trended in parallel. The only possible exception seen was a higher regard for their own brand shown by the local panel R-preferrers, but this balanced out in Table V where 57.2% of them and 58.2% of the national R-preferrers scored R equal with or higher than their own brand. Effect of Test Procedure on Responses It should be remembered that a reason for the use of small panels of discriminating and articulate consumers, as represented by the local panel, is to obtain the necessary product information as efficiently as possible, as is the case for most consumer test operators. Each local panel member has been relied on to respond succinctly in a blank space of 7•/2 X 1•/5 in. to the following questions' "What did each member of your family think about these toothpastes ? What did he like and dis- like about each one ? Which one of the two did he like better ? Why did he like it better ? Please explain as fully as you can." Table V Preferrers' Ratings of the Two Products in Comparison with Their Own Brands (Derived from Hedonic Scores) R-Preferrers About R About W Local National Local National (%) (%) (%) (%) [21.9 23.66} 582 Morethan 10.0 { 2.0 0.•} 10.4 57.2 (35.3 34 ' Equal to 8.0 9. 42.8 41.6 Less than 88.0 84.6 0 0.3 No answer 2.0 5.1 W-Preferrers About W About R Local National Local National (%) (%) (%) (%) •34.8 34 71 4 31 6 ' 3 66.3 (31.5 37 ' Equal to ' 28.3 16.9 f 33.7 26.4 Less than 67.4 73.6 0 2.1 No answer 1.1 3.2
Purchased for the exclusive use of nofirst nolast (unknown)
From: SCC Media Library & Resource Center (library.scconline.org)