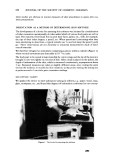
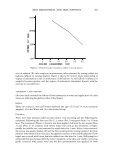
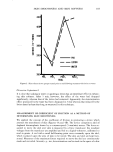
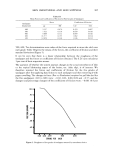
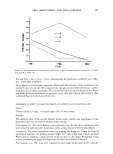
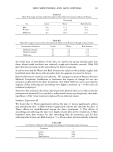
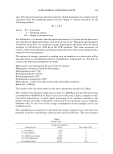
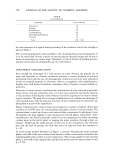
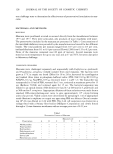
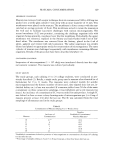
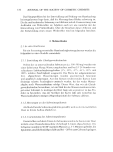
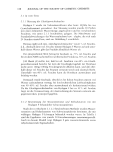
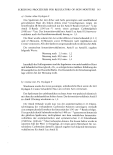
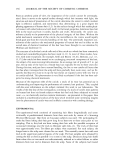
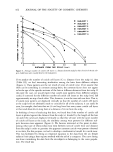
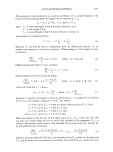
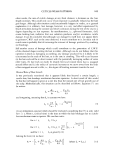
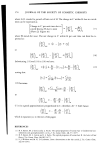
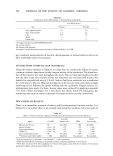
SKIN SMOOTHNESS AND SKIN SOFTNESS 101 10 ..% loo 5 lO 15 20 25 30 BALLOON EIRCUAAFERENCE (CAA) Figure 2. Softness of surface of a balloon inflated to varying degrees tion of softness. We next employed a quantitative index obtained by testing rubber toy balloons inflated to varying degrees. Figure 2 shows the inverse linear relationship of degree of indentation to the circumference of the balloon. As the balloon is inflated, its turgidity becomes greater, and the degree of indentation diminishes linearly with the increase in circumference. EXPERIMENT I: SKIN SOFTNESS Our first study assessed the effects of both immersion in water and application of a skin lotion on softening the glabrous skin of the fingers. S•bjects Thirty-two subjects, men and women beeween the ages of 25 and 54, were randomly assigned, 16 to the Water and 16 to the Lotion Group. Procedures There were four measures taken in each subject: two preceding and two following the treatment. Following the first test (Pre 1), a retest (Pre 2) was given from 1 to 10 min later. The treatment (Water or Lotion) was then applied, followed by two retests (Post 1) and (Post 2). In subjects with whom water was used as the treatment, a finger, usually the middle one, was immersed in tepid water for 5 min. After it was removed, the excess was gently shaken off and the first posttreatment testing initiated. In those subjects with whom lotion was used, the glabrous surface of the middle phalanx of one finger was covered with lotion that was rubbed into the skin for 1 min. Following four additional minutes during which the lotion remained on the skin, any visible excess was gently removed with cotton wool and the first posttreatment test applied. In both

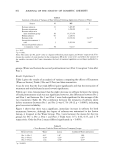
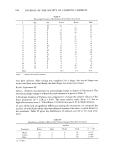
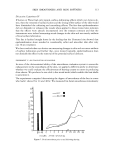
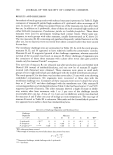
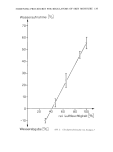
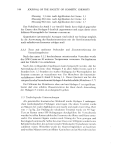
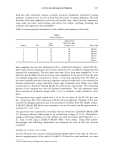
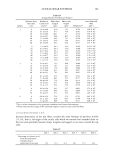
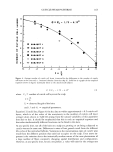
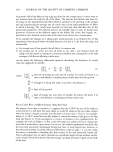
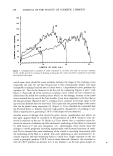
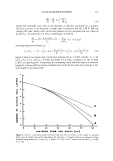
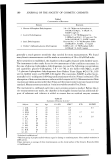
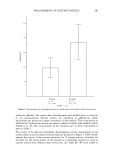
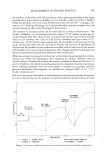
102 JOURNAL OF THE SOCIETY OF COSMETIC CHEMISTS Table I Summary of Analysis of Variance of Skin Softness Following Application of Lotion or Water Source df MS F Between subjects 31 7,485.85 Between treatments 1 1,458.00 1 Between subjects in same treatment group 30 15,373.56 Within subjects 96 1,328.52 Between trials 3 12,943.64 14.19'* Interaction treatment x trial 3 2,203.64 2.42* Interaction pooled subjects x treatment x trial 90 912.17 *p 0.07. **p 0.001. Note: The terms "df, MS, and F" refer to "degrees of freedom, mean square, and F-ratio" respectively dfin- dicates the number of units involved in the comparison MS is the "error term" and reflects the variance of the variable concerned the F ratio determines the level of statistical significance according to published ta- bles. groups (Water and Lotion) the second posttreatment test (Post 2) was given 5 min after Post 1. Results.' Experiment I Table I gives the results of an analysis of variance comparing the effects of Treatment (Water or Lotion), Trials (2 Pre and 2 Post) and their interaction. It can be seen that the four trials differed quite significantly and that the interaction of treatment and trial indicated a trend toward significance. Follow-up t tests demonstrated that the slight decrease in softness between the means of both pretreatment trials was not significant however, the differences between Pre 2 and Post 1 and between Pre 2 and Post 2 were both significant for the average of the two treatments (Table II). The correlation between the measures of softness taken before treatment (between Pre 1 and Pre 2) was 0.754 (30 df, p 0.0005), indicating good test-retest reliability. Figure 3 shows that there was a significant, immediate increase in softness for both treatments however, although the degree of softness was maintained in the Lotion Group, it dropped in the Water Group. The t tests between the means for the two groups for Pre 1, Pre 2, Post 1 and Post 2 Trials were: 0.73, 0.46, 0.55, and 2.79 respectively. Only the Post 2 means differed significantly (p 0.005). Table II t Tests Between Trials for Water and Lotion Treatment Groups Between Trials Water Lotion Combined Water and Lotion Pre 1--Pre 2 0.67 1.87 1.80 Pre 2--Post 1 4.34* 4.24* 6.07* Pre 2--Post 2 1.34 4.58* 4.19' *p 0.0005.
Purchased for the exclusive use of nofirst nolast (unknown)
From: SCC Media Library & Resource Center (library.scconline.org)