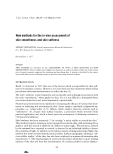
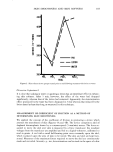
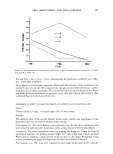
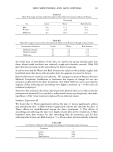
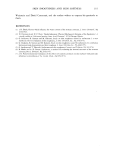
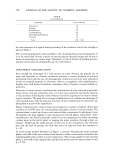
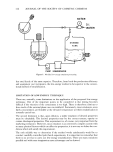
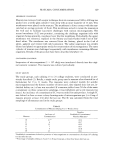
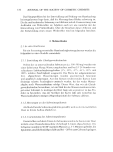
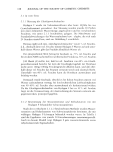
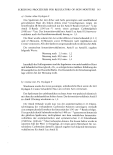
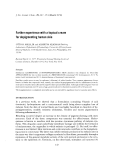
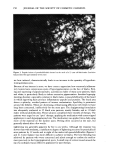
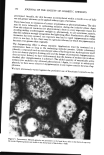
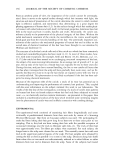
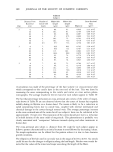
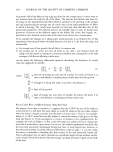
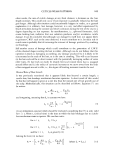
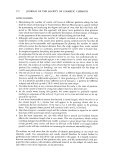
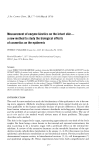
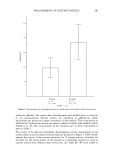
158 JOURNAL OF THE SOCIETY OF COSMETIC CHEMISTS Figure 1. Photomicrograph of edge of a cross-sectional cut of a hair fiber at the root end taken at the magnification (10,000X) that was used to count number of cell layers. Eight cuticle cell layers can be counted examined at each of the distances from the scalp for each hair. The value recorded as the number of cuticle cell layers for that distance was the maximum number of layers that could be unequivocally counted in any of the cuts among the five examined. Figures 1 and 2 are photomicrographs of the edges of cross-sectional cuts typical of the ones used to count the number of cell layers. MINOR AND MAJOR AXES, ELLIPTICITY AND CROSS-SECTIONAL AREA The major axis was determined by measuring the length of the longest possible straight line drawn from one side of the photornicrographed cross section to the other passing through the center of the cortex. The minor axis was determined by measuring the length of a straight line drawn perpendicular to and bisecting the major axis and extending from one side of the photomicrographed cross section to the other. Obviously, the magnification used is taken into account. The ellipticity was calculated by dividing the minor axis by the major axis. The cross-sectional areas were determined by measuring the areas of the cross-sectional views on the photomicrographs. This was done by cutting the outline of the cross-

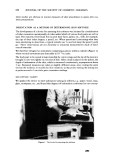
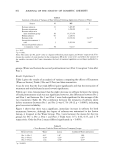
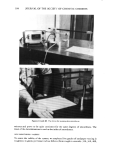
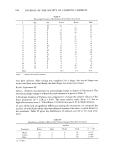
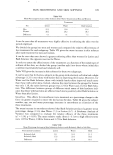
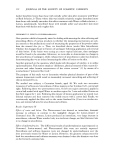
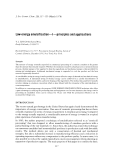
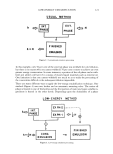
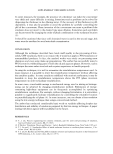
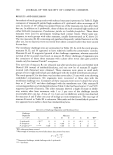
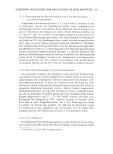
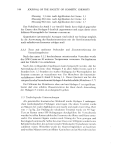
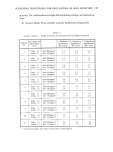
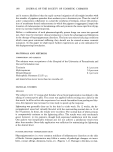
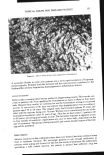
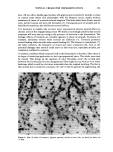
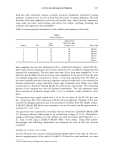
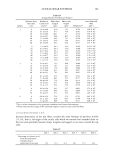
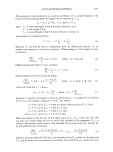
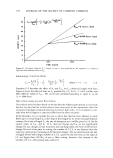
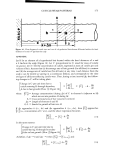
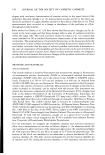
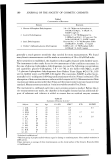
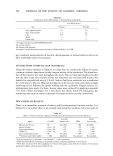
CUTICLE-WEAR PATTERNS ! 59 Figure 2. Photomicrograph of edge of a cross-sectional cut of a hair fiber at 40 cm from the root end of a 60-cm-long hair (taken at 10,000X). Four cuticle cell layers can be counted sectional views and weighing the cutouts with an analytical balance. The actual areas were then calculated, taking into account the magnification used (usually 1,000 X) and the weight per unit area of the Polaroid print paper. This method was chosen becauseitcrossthe is more accurate than the one involving the use of the major and minor axes of sections and the formula for the area of an ellipse. The S.E.M. magnificationtheon photomicrographs was checked using a calibrated grid. RESULTS The data in Table II corresponds to three of the ten hairs that were examined from Subject 1. It illustrates the type of natural variability found from hair to hair subject. Table III contains the average value for the ten hairs examined for each subjectawithin CROSS-SECTIONAL AREA AND ELLIPTICITY The cross-sectional area values are of interest because they do not show a reductionin going from the root to the tip end of the fibers as could be expected due to cuticle loss if the cortex dimensions did not change in the process. Actually, small increases were observed in the hairs of some of the subjects examined.
Purchased for the exclusive use of nofirst nolast (unknown)
From: SCC Media Library & Resource Center (library.scconline.org)